JointJS+ changelog v4.2.0
Overview
Version 4.2 brings 7 new applications, improved layout-driven editing, a powerful Layers API, and major performance improvements for large diagrams.
Guided layout-driven diagram editing
This release focuses on structured, guided diagram editing, with automatic node placement rather than free drag-and-drop.
In such applications, the underlying data model is often simpler than the visual representation. To address this, we introduce a pattern where the data model serves as the single source of truth, and the diagram graph is automatically generated from it (see diagram below).
This approach is especially useful when a single data change triggers multiple visual updates, such as rearranging elements via automatic layout or updating node styles (e.g. marking a task as at risk
after changing due date). It lets you keep your data model minimal while the graph handles the visual representation.
For seamless integration, we:
-
Updated our CommandManager and Inspector to work smoothly with any mvc.Model (our data model).
-
Added graph.syncCells() to efficiently update diagrams from JSON.
-
Focused on automatic layouts - the alpha and omega of structured diagram editing:
- Introduced a layout adapter for Microsoft Automatic Graph Layout (MSAGL) with support for orthogonal/parallel links.
- DirectedGraph now supports the disableOptimalOrderHeuristic option to preserve sibling order during layout.
- Added a new ELKJS example that makes it easier to layout an existing diagram, setting the stage for a future adapter package.
Three of the seven new applications introduced in this release leverage this pattern (AI Agent Builder, Fishbone, PERT Chart).
The example below demonstrates how this works: you can connect elements, remove elements and links, and create new elements by clicking a node.
Implementation details...
The core of this implementation is the DiagramData model, which holds a minimal representation of the diagram in a JSON-like structure. It captures only the essential information about nodes and their relationships, without any visual details.
The buildGraph() function is responsible for translating the DiagramData model into a full-fledged dia.Graph. It creates elements and links based on the data, applies automatic layout using DirectedGraph.layout(), and adds the cells to the graph.
User interactions (like connecting nodes, removing elements, or adding new nodes) update the DiagramData model. For example:
- When a user connects two nodes, the
toarray of the source node inDiagramDatais updated to include the target node's ID. - When a user removes an element, the corresponding entry is deleted from
DiagramData. - When a user adds a new node, a new entry is created in
DiagramDatawith default properties.
The CommandManager listens to changes in the DiagramData model and records them as commands, enabling undo/redo functionality for all user actions that modify the diagram data.
If you check example.json, you will see that only essential information is stored:
{
    "start": {
        "label": "New support ticket",
        "to": [{ "id": "ai-agent" }]
    },
    "ai-agent": {
        "to": [
            { "label": "Solved", "id": "action-1" },
            { "label": "Needs human support", "id": "action-3" }
        ],
        "label": "Customer support AI agent"
    },
    "action-1": {
        "to": [{ "id": "action-2" }],
        "label": "Update Ticket"
    },
    "action-2": {
        "to": [],
        "label": "Send to Slack"
    },
    "action-3": {
        "to": [{ "id": "decision-1" }],
        "label": "Create Issue"
    },
    "decision-1": {
        "to": [
            { "label": "Low priority", "id": "action-4" },
            { "label": "High priority", "id": "action-5" }
        ],
        "label": "Check priority"
    },
    "action-4": {
        "to": [],
        "label": "Send to Slack"
    },
    "action-5": {
        "to": [],
        "label": "Send SMS"
    }
}
Layers API
In version 4.2, we've also made significant changes to the core of the library. The Graph has been refactored, as the new Layers API required a rethink of the existing architecture. The graph now has a collection of layers, with each layer maintaining its own attributes and a collection of cells, each within the layer's own stacking context for z-index ordering. Events bubble up from the cell, through layers, to the graph, all in a backwards-compatible manner.
Applications can now enable layer support, allowing users to add/remove layers, toggle visibility, and control interactivity. This is the straightforward use case, but layers also unlock additional possibilities:
- Treat layers as groups of cells with their own stacking context. This allows grouping a container and its cells into a layer, ensuring that children always follow the container when its z-index changes, without interference from other elements.
- On the view side, cells within a layer are now children of a dedicated
<g/>element. You can apply CSS variables, filters, or clip-paths to individual layers, and animate collapse/expansion of containers (see experimental example).
Here is an example of the new layers API in action:
Optimized rendering and memory management
The Paper has been tuned to optimize memory usage by lazy-loading views and disposing of those no longer needed (e.g. out-of-viewport, collapsed branches).
On top of that, we improved:
- Enhanced autoFreeze mechanism to reduce CPU usage on empty render loops.
- Add built-in virtual rendering support, leveraging the SearchGraph to quickly find and display only views currently in the viewport.
- Support offscreen rendering avoiding unnecessary reflows and DOM measurements.
These changes lay the groundwork for HTMLCanvas rendering, improving performance when displaying large diagrams where all nodes must be shown at once (e.g. bird's-eye view, minimap). See experimental example (when you zoom out enough, the rendering switches to canvas).
We made other improvements and bug fixes across the library. See details below!
apps
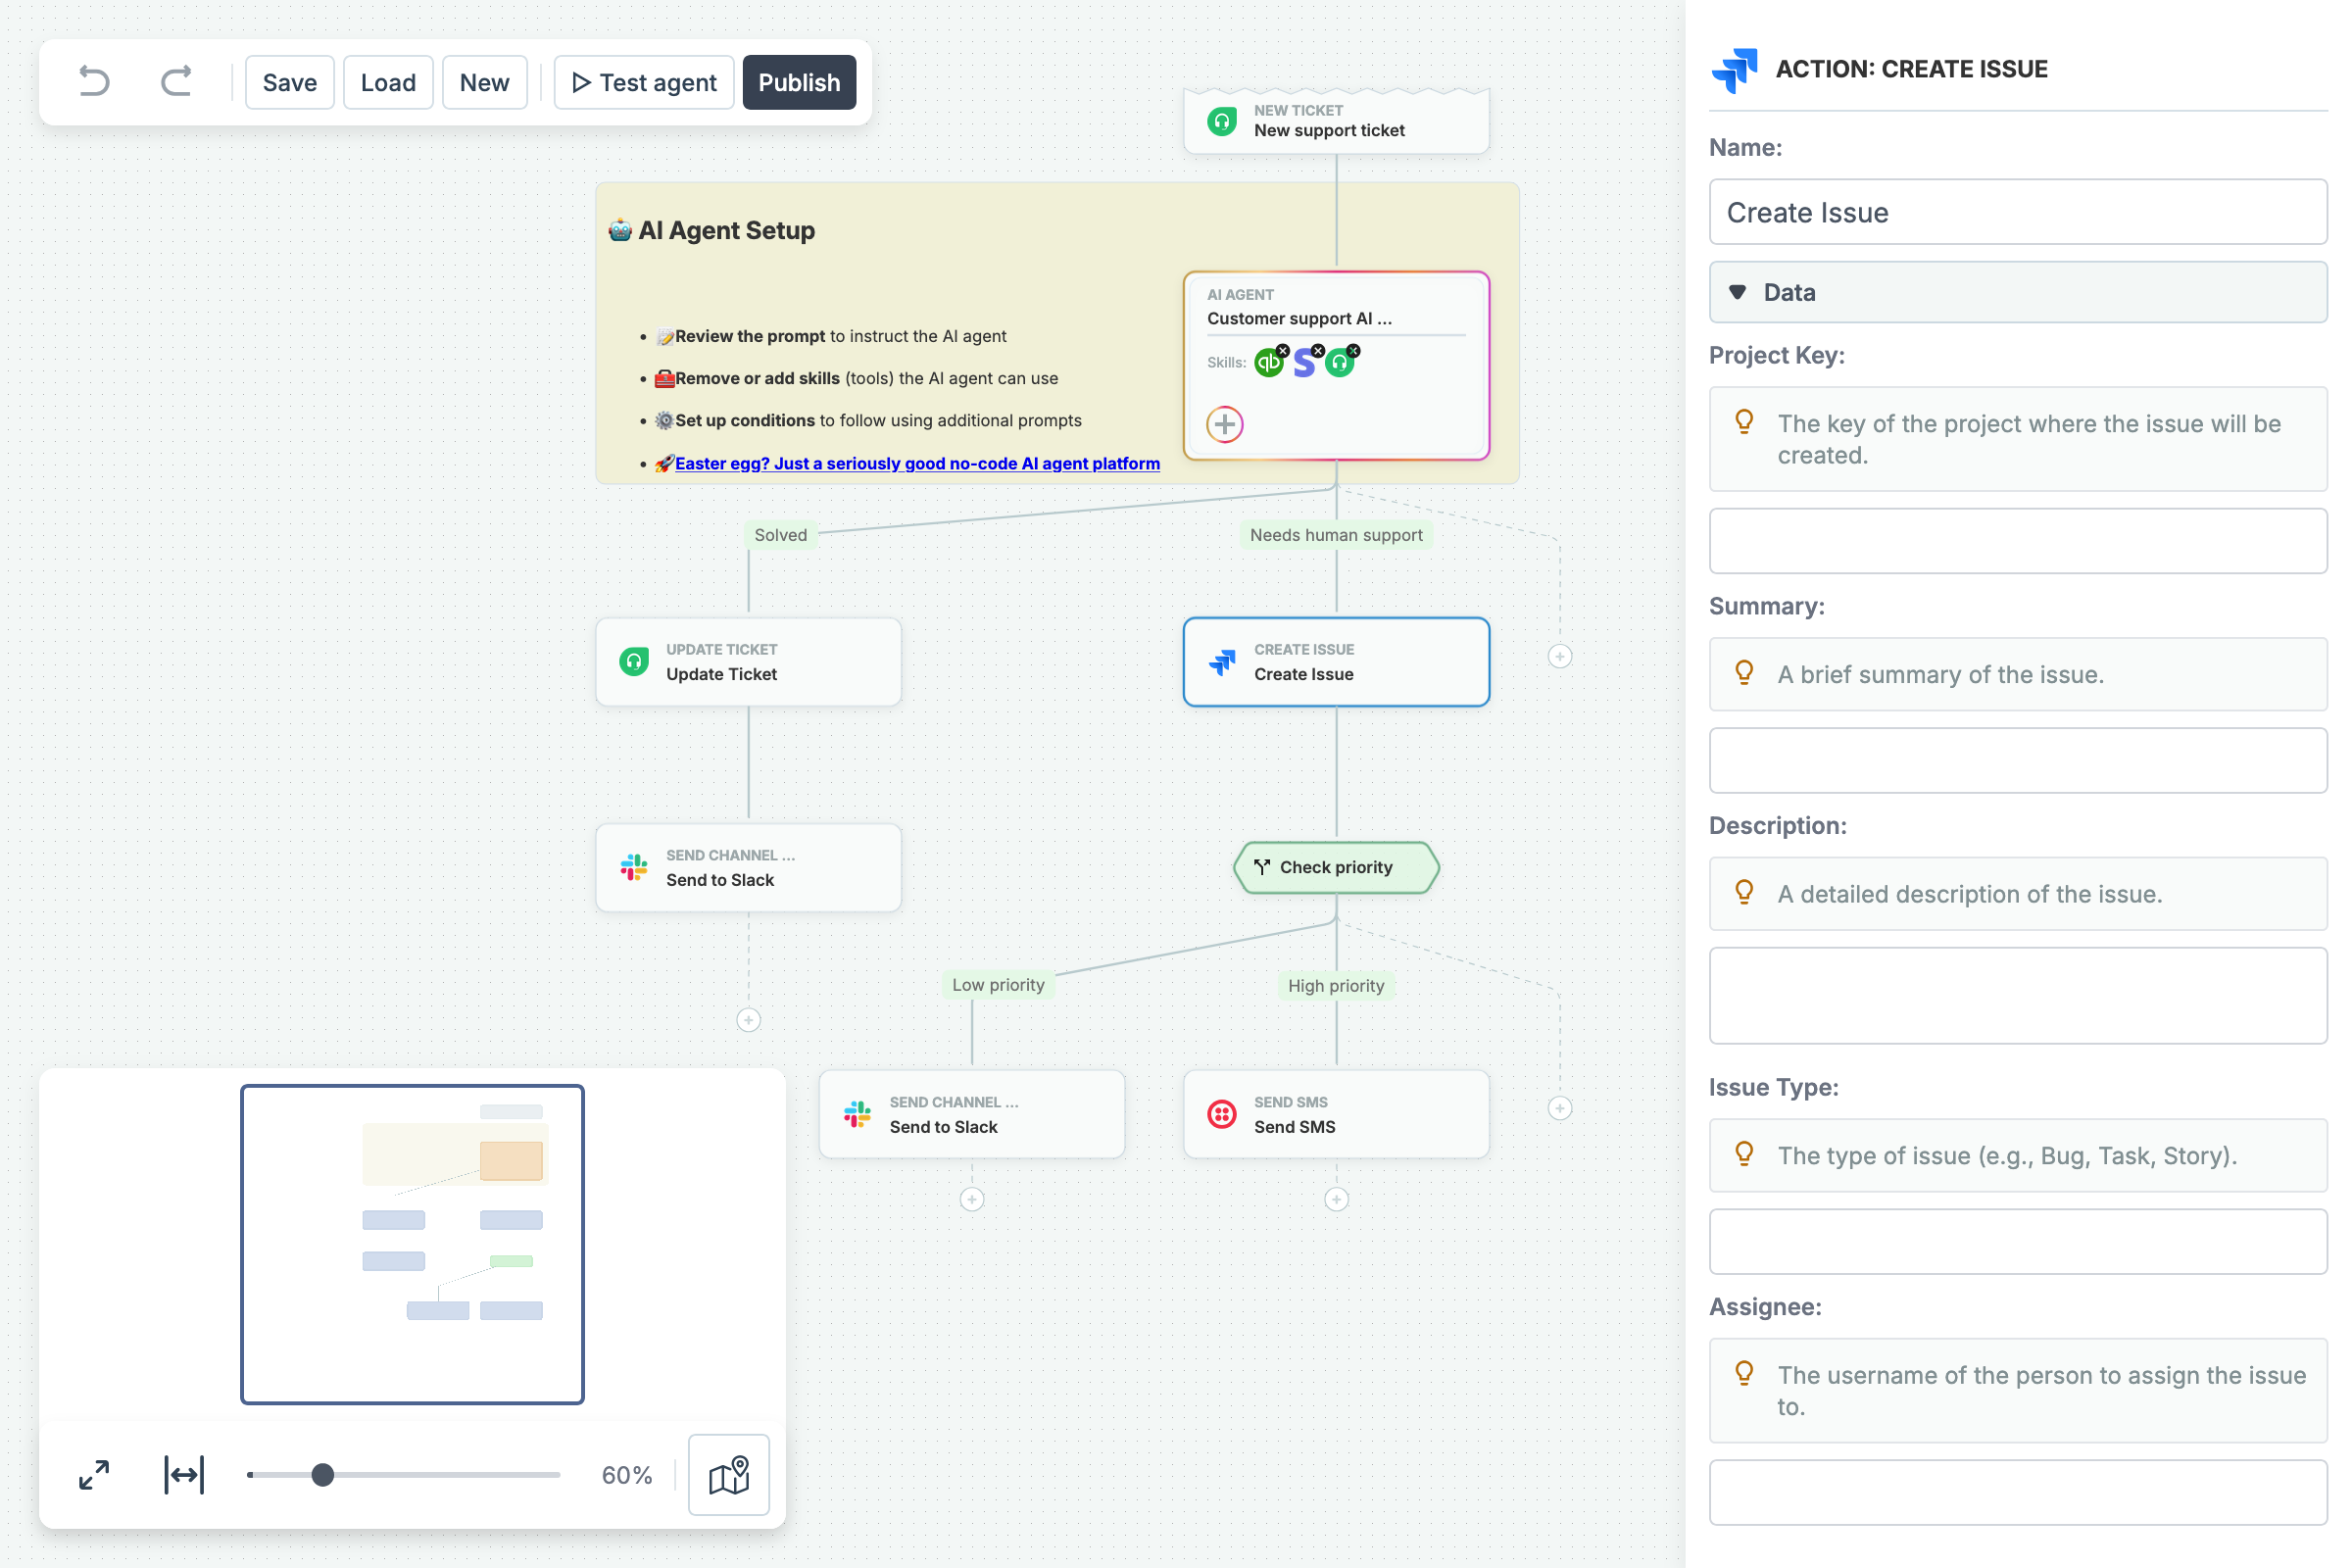
AI Agent Builder
apps.AIAgent - add new app
Enable your users to design AI agents through an interactive, drag-and-drop interface built right into your web app. This demo showcases how they can visually build AI-driven workflows, integrate third-party apps, add logic blocks, and define behaviors - all within a smooth, intuitive experience. Extend the default workflow or build your own from scratch - add new actions, configure agents, jot down notes, and explore everything the diagram can do.
Implementation details...
- The example uses a custom
DataModel, which serves as the single source of truth for the diagram.- The underlying data consists of a simple dictionary of elements without unnecessary properties (visual attributes such as positions, dimensions and colors are omitted because they are computed dynamically or predefined within the model).
- This method is ideal for guided or incremental diagrams where free-form editing is not allowed.
- The
DataModelfunctions as anmvc.Model, ensuring that any updates to the model are automatically reflected in the graph. - Instead of applying modifications directly to the
graph, all UI interactions are routed through theDataModel. - Both the CommandManager and the Inspector operate by modifying the
DataModel.
- Sibling order preservation is achieved via the
disableOptimalOrderHeuristicoption oflayout.DirectedGraph. - The
Noteelement supports Markdown formatting through the Showdown library. - The Navigator showcases the use of the new
dynamicZoomfeature.
BPMN
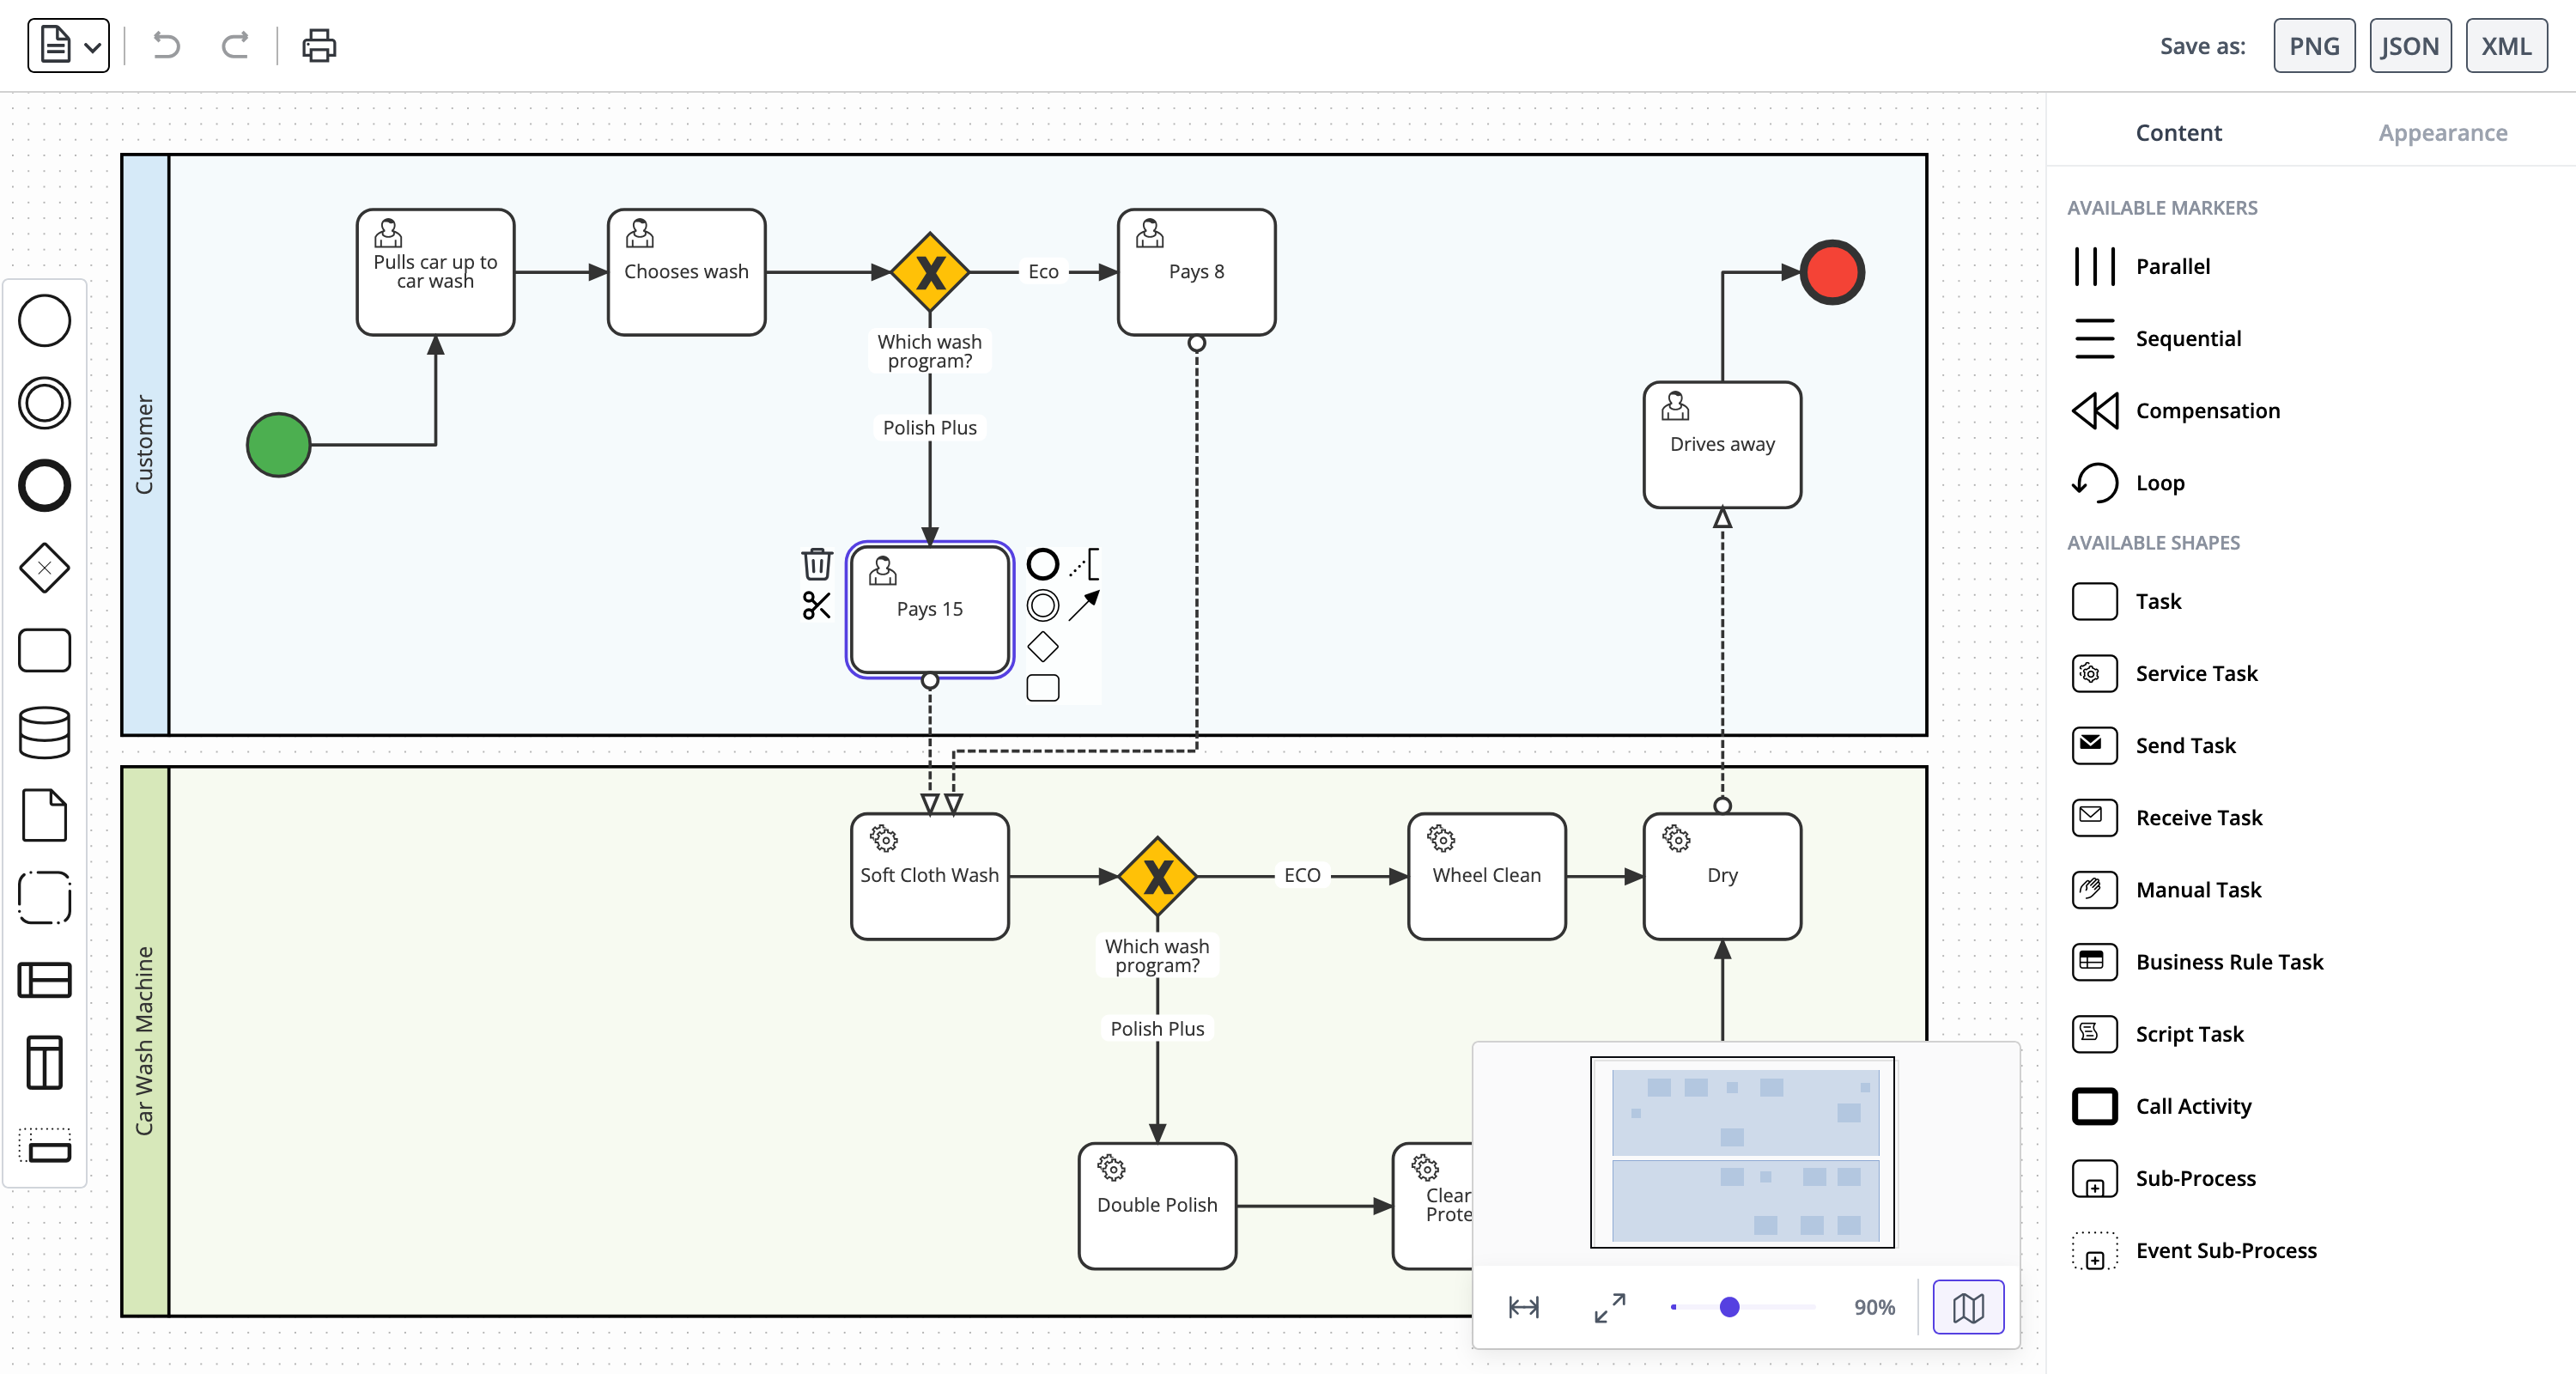
apps.BPMNEditor - add new app
The BPMN Editor demo app showcases a standardized method of modeling a business process from beginning to end. It's written in TypeScript but can be seamlessly integrated with React, Vue, Angular, Svelte, or LightningJS.
For this release, we have overhauled the demo with new shapes and new functionality including a minimalist element palette, a dynamic minimap, and a tabbed property editor and viewer.
Implementation details...
- The demo showcases JointJS+ BPMN shapes, including CompositePool, which can contain a variable number of Swimlanes via drag-and-drop.
- The example follows the BPMN specification, with each BPMN entity implemented as a separate JointJS shape class (for example, Service, User and Script each have their own dedicated class).
- Clicking an element reveals the redesigned Halo component, which displays a contextual element palette around the shape.
- The demo features simplified link creation, where a single interaction sets both the target shape and specific points on its boundary (using the
snapLinksfeature). - The
graph.syncCells()method is used here to replace existing cells with new cells of a different type. - You can import a diagram by dropping a
.bpmn,.xml, or.jsonfile onto the canvas.
Cables
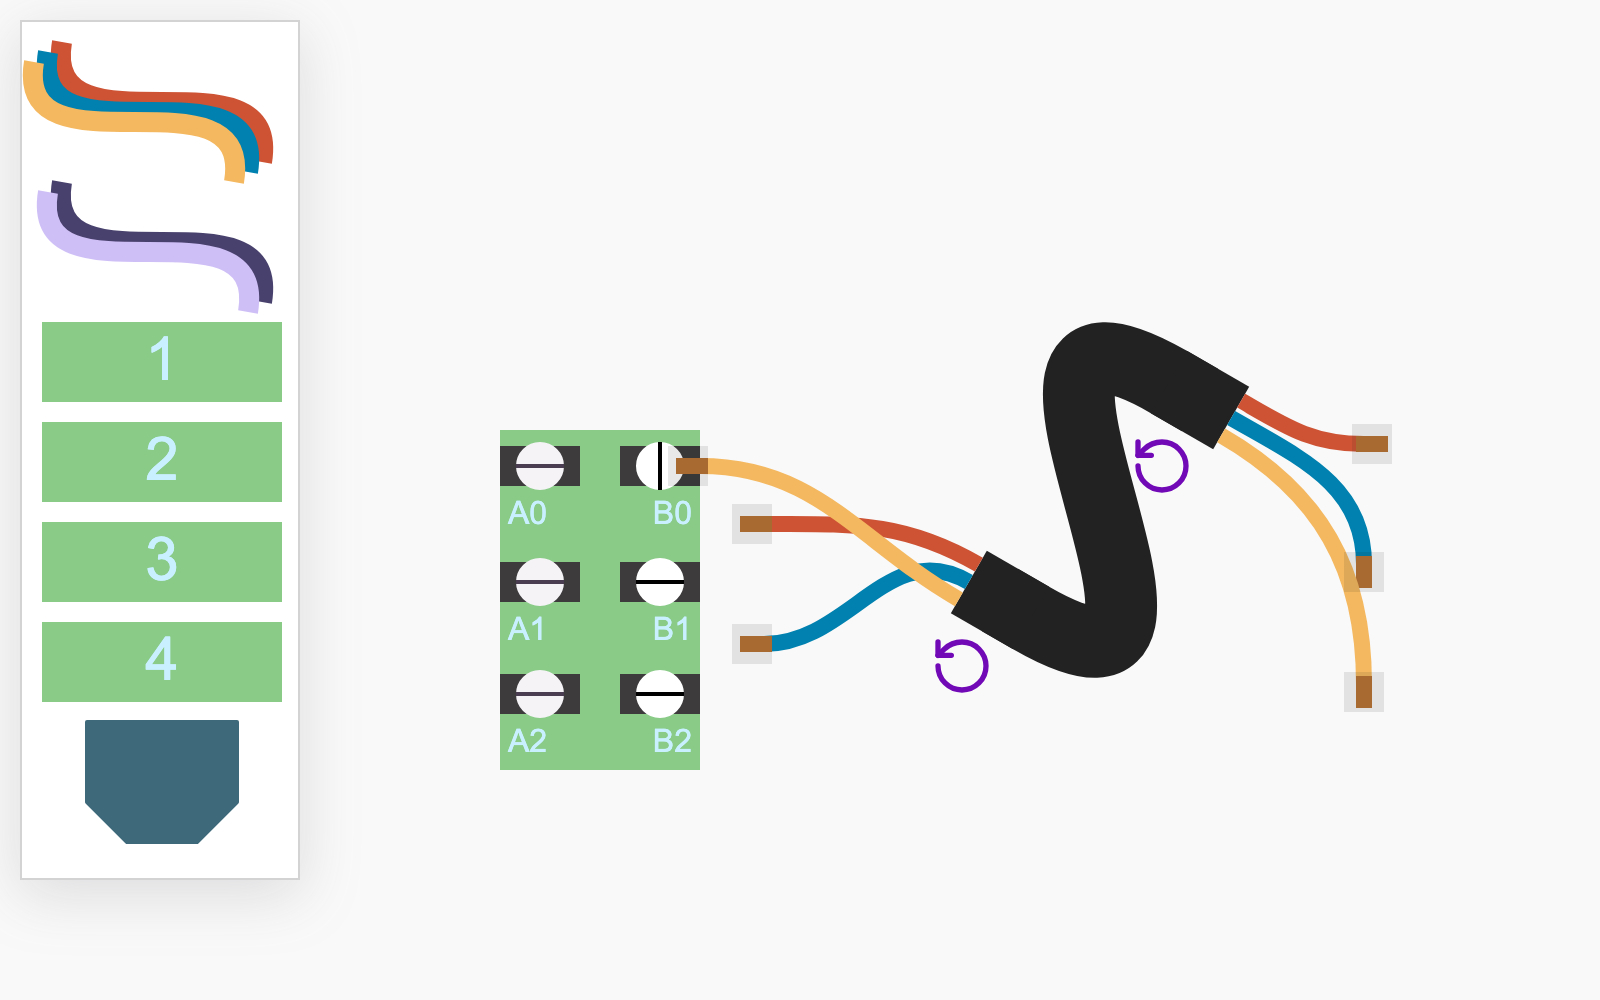
apps.Cables - add new app
Need to create interactive wiring diagrams? Explore our Cables demo, built with JointJS+ and TypeScript. The demo starts with a simple example, showing a cable connected to a terminal block, introducing the software's capabilities.
Implementation details...
- Cables are composite cells composed of two elements, multiple links, and SVG markers.
- The stencil cable is a
dia.Elementcomposed of multiple SVG<path>nodes. The composite cable is created when the item is dropped onto the canvas. - Port animations are implemented using CSS transitions by applying a class highlighter on
link:connect. - Double-clicking a port disconnects its link and repositions the link's endpoint near the original port position.
Fishbone
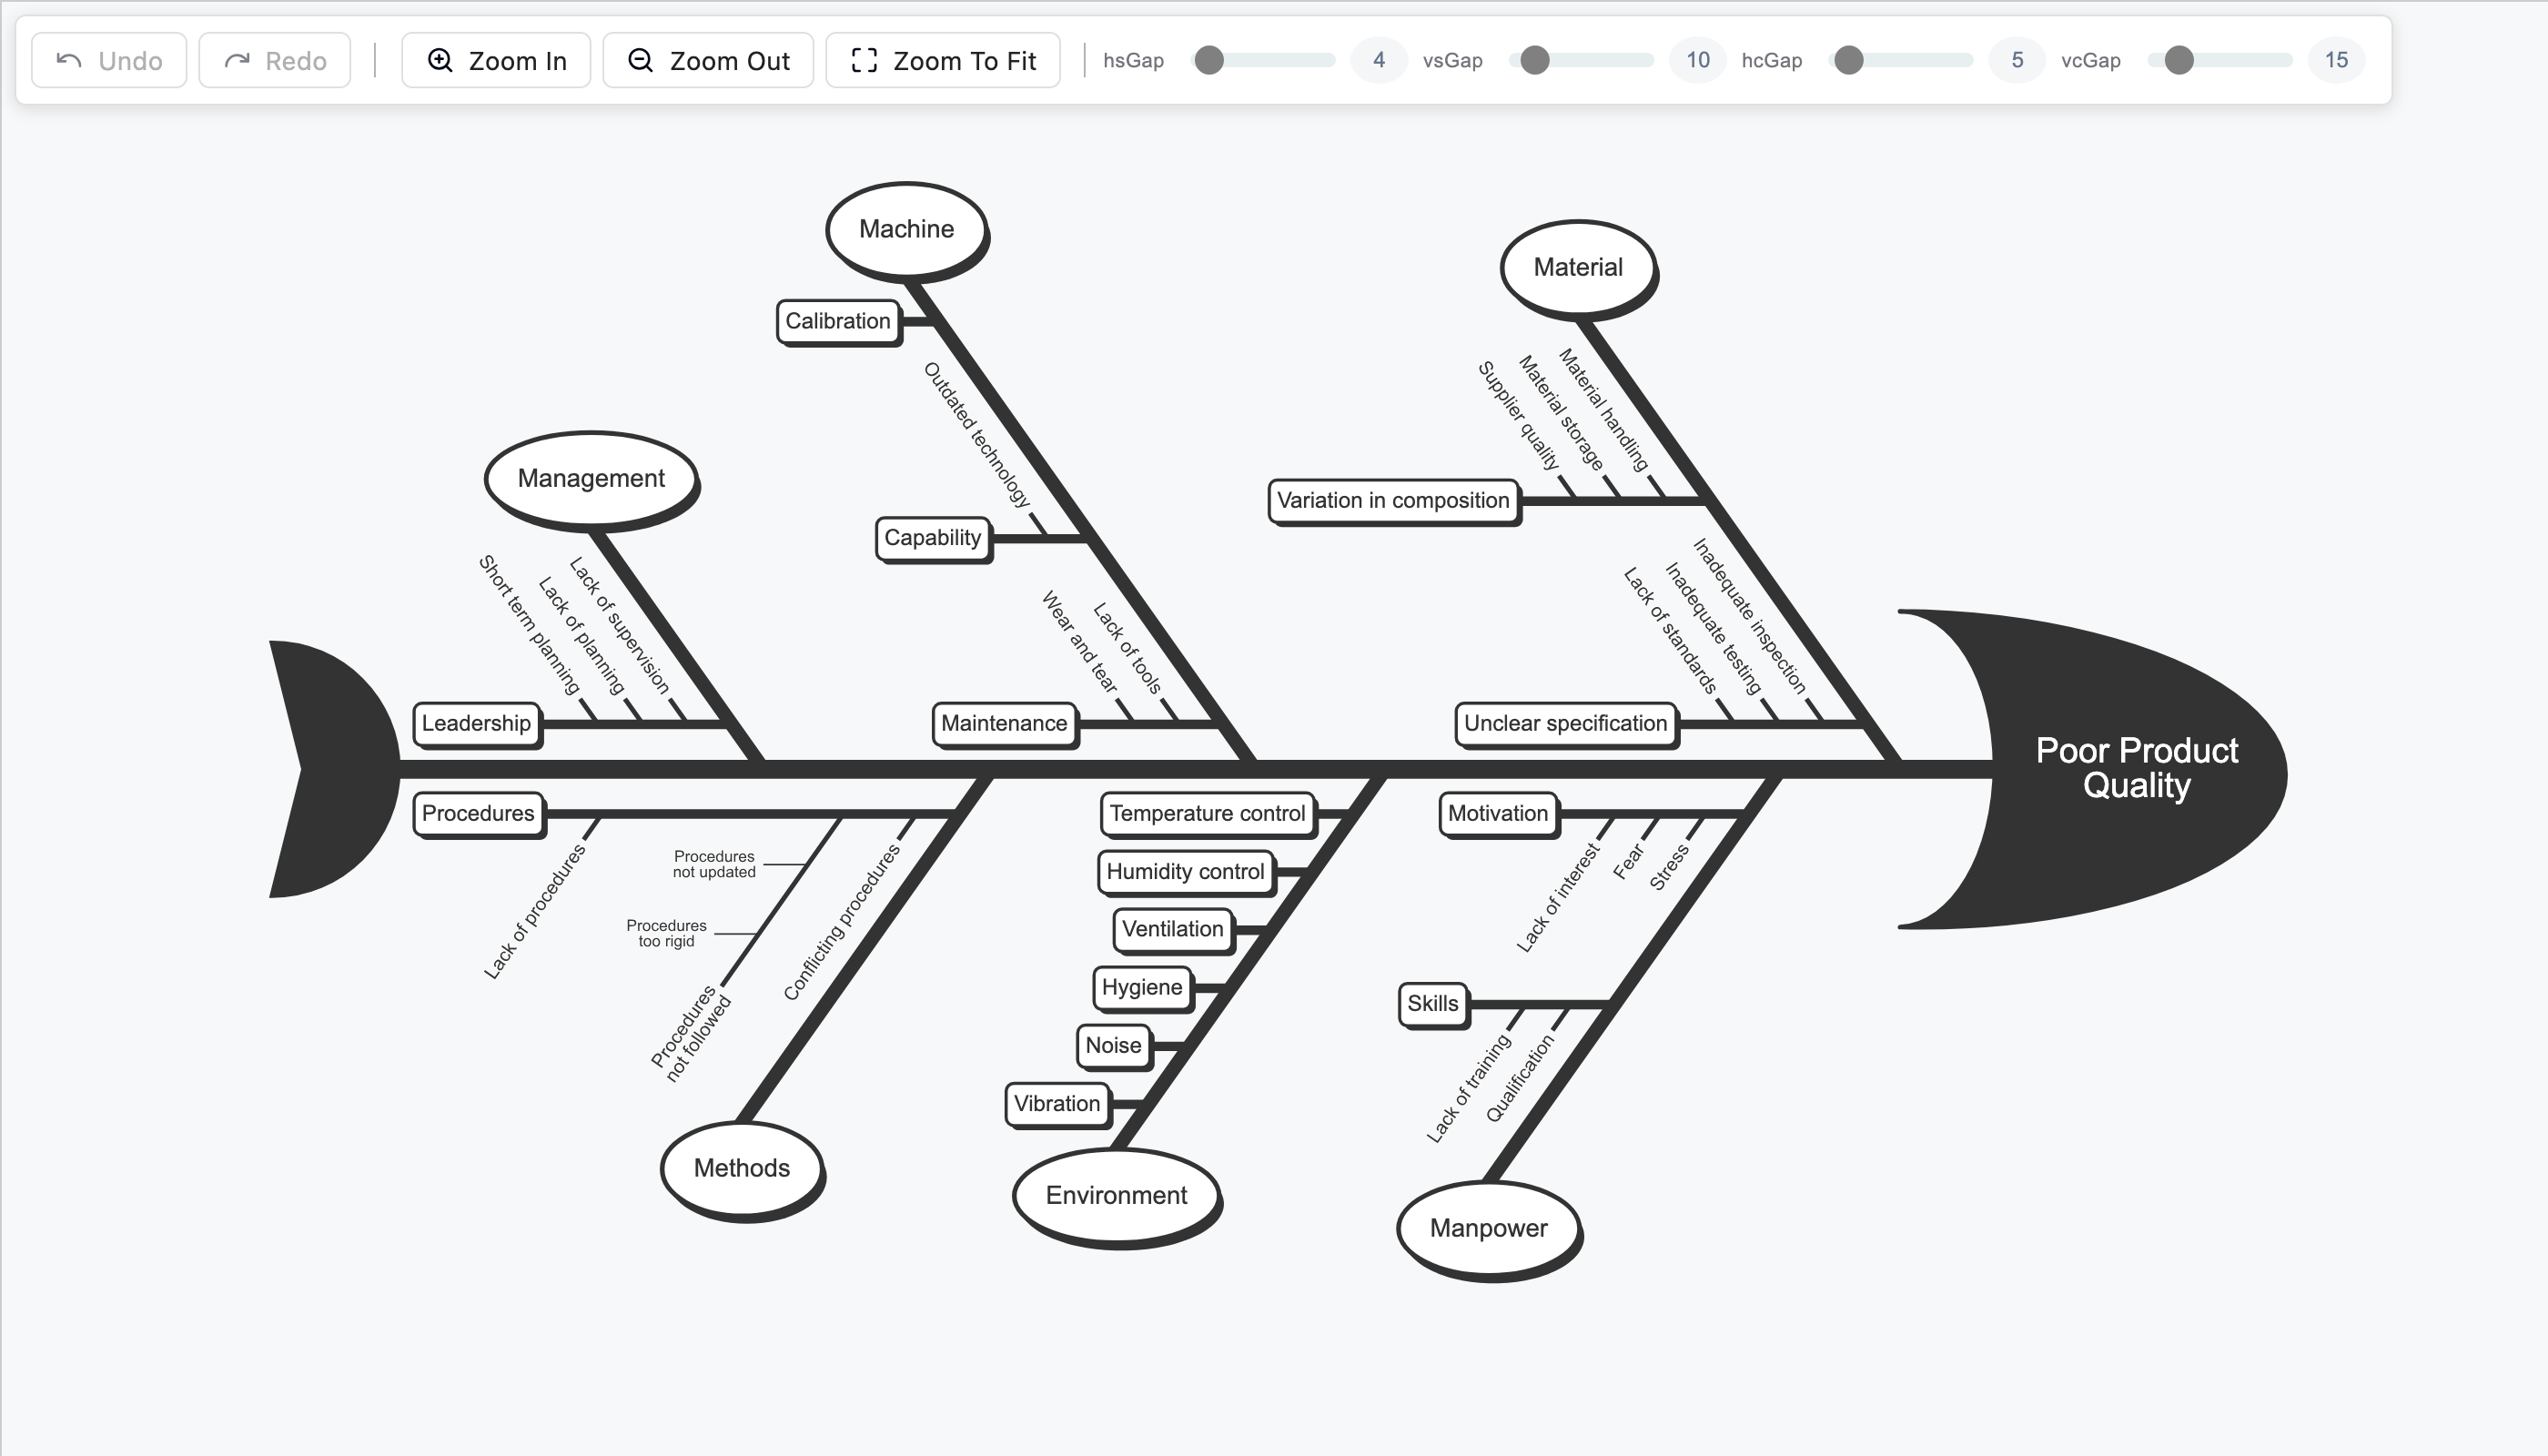
apps.Fishbone - add new app
This demo showcases a Fishbone diagram, also known as an Ishikawa or cause-and-effect diagram. It's a useful tool for visually identifying and organizing the potential root causes of a problem. Use it to break down complex issues into categories such as Material, Machine, Management, or Environment. The clear structure helps teams explore all possible contributing factors, making it ideal for root cause analysis, retrospectives, quality management, and collaborative problem-solving.
Implementation details...
- The example uses a custom automatic layout.
- Text dimensions are measured on an HTML canvas, after which the size is applied and the layout executed.
- Cells generated from data are applied to the graph using the
graph.syncCells()method. - Hover shape animations are implemented entirely in CSS.
PERT Chart
apps.PertChart - add new app
Effective project management relies on clear visualization techniques. One such technique is the PERT chart, which you can explore in the read-only demo below. It highlights key JointJS+ features like zoom and pan, automatic layout, events and custom shapes.
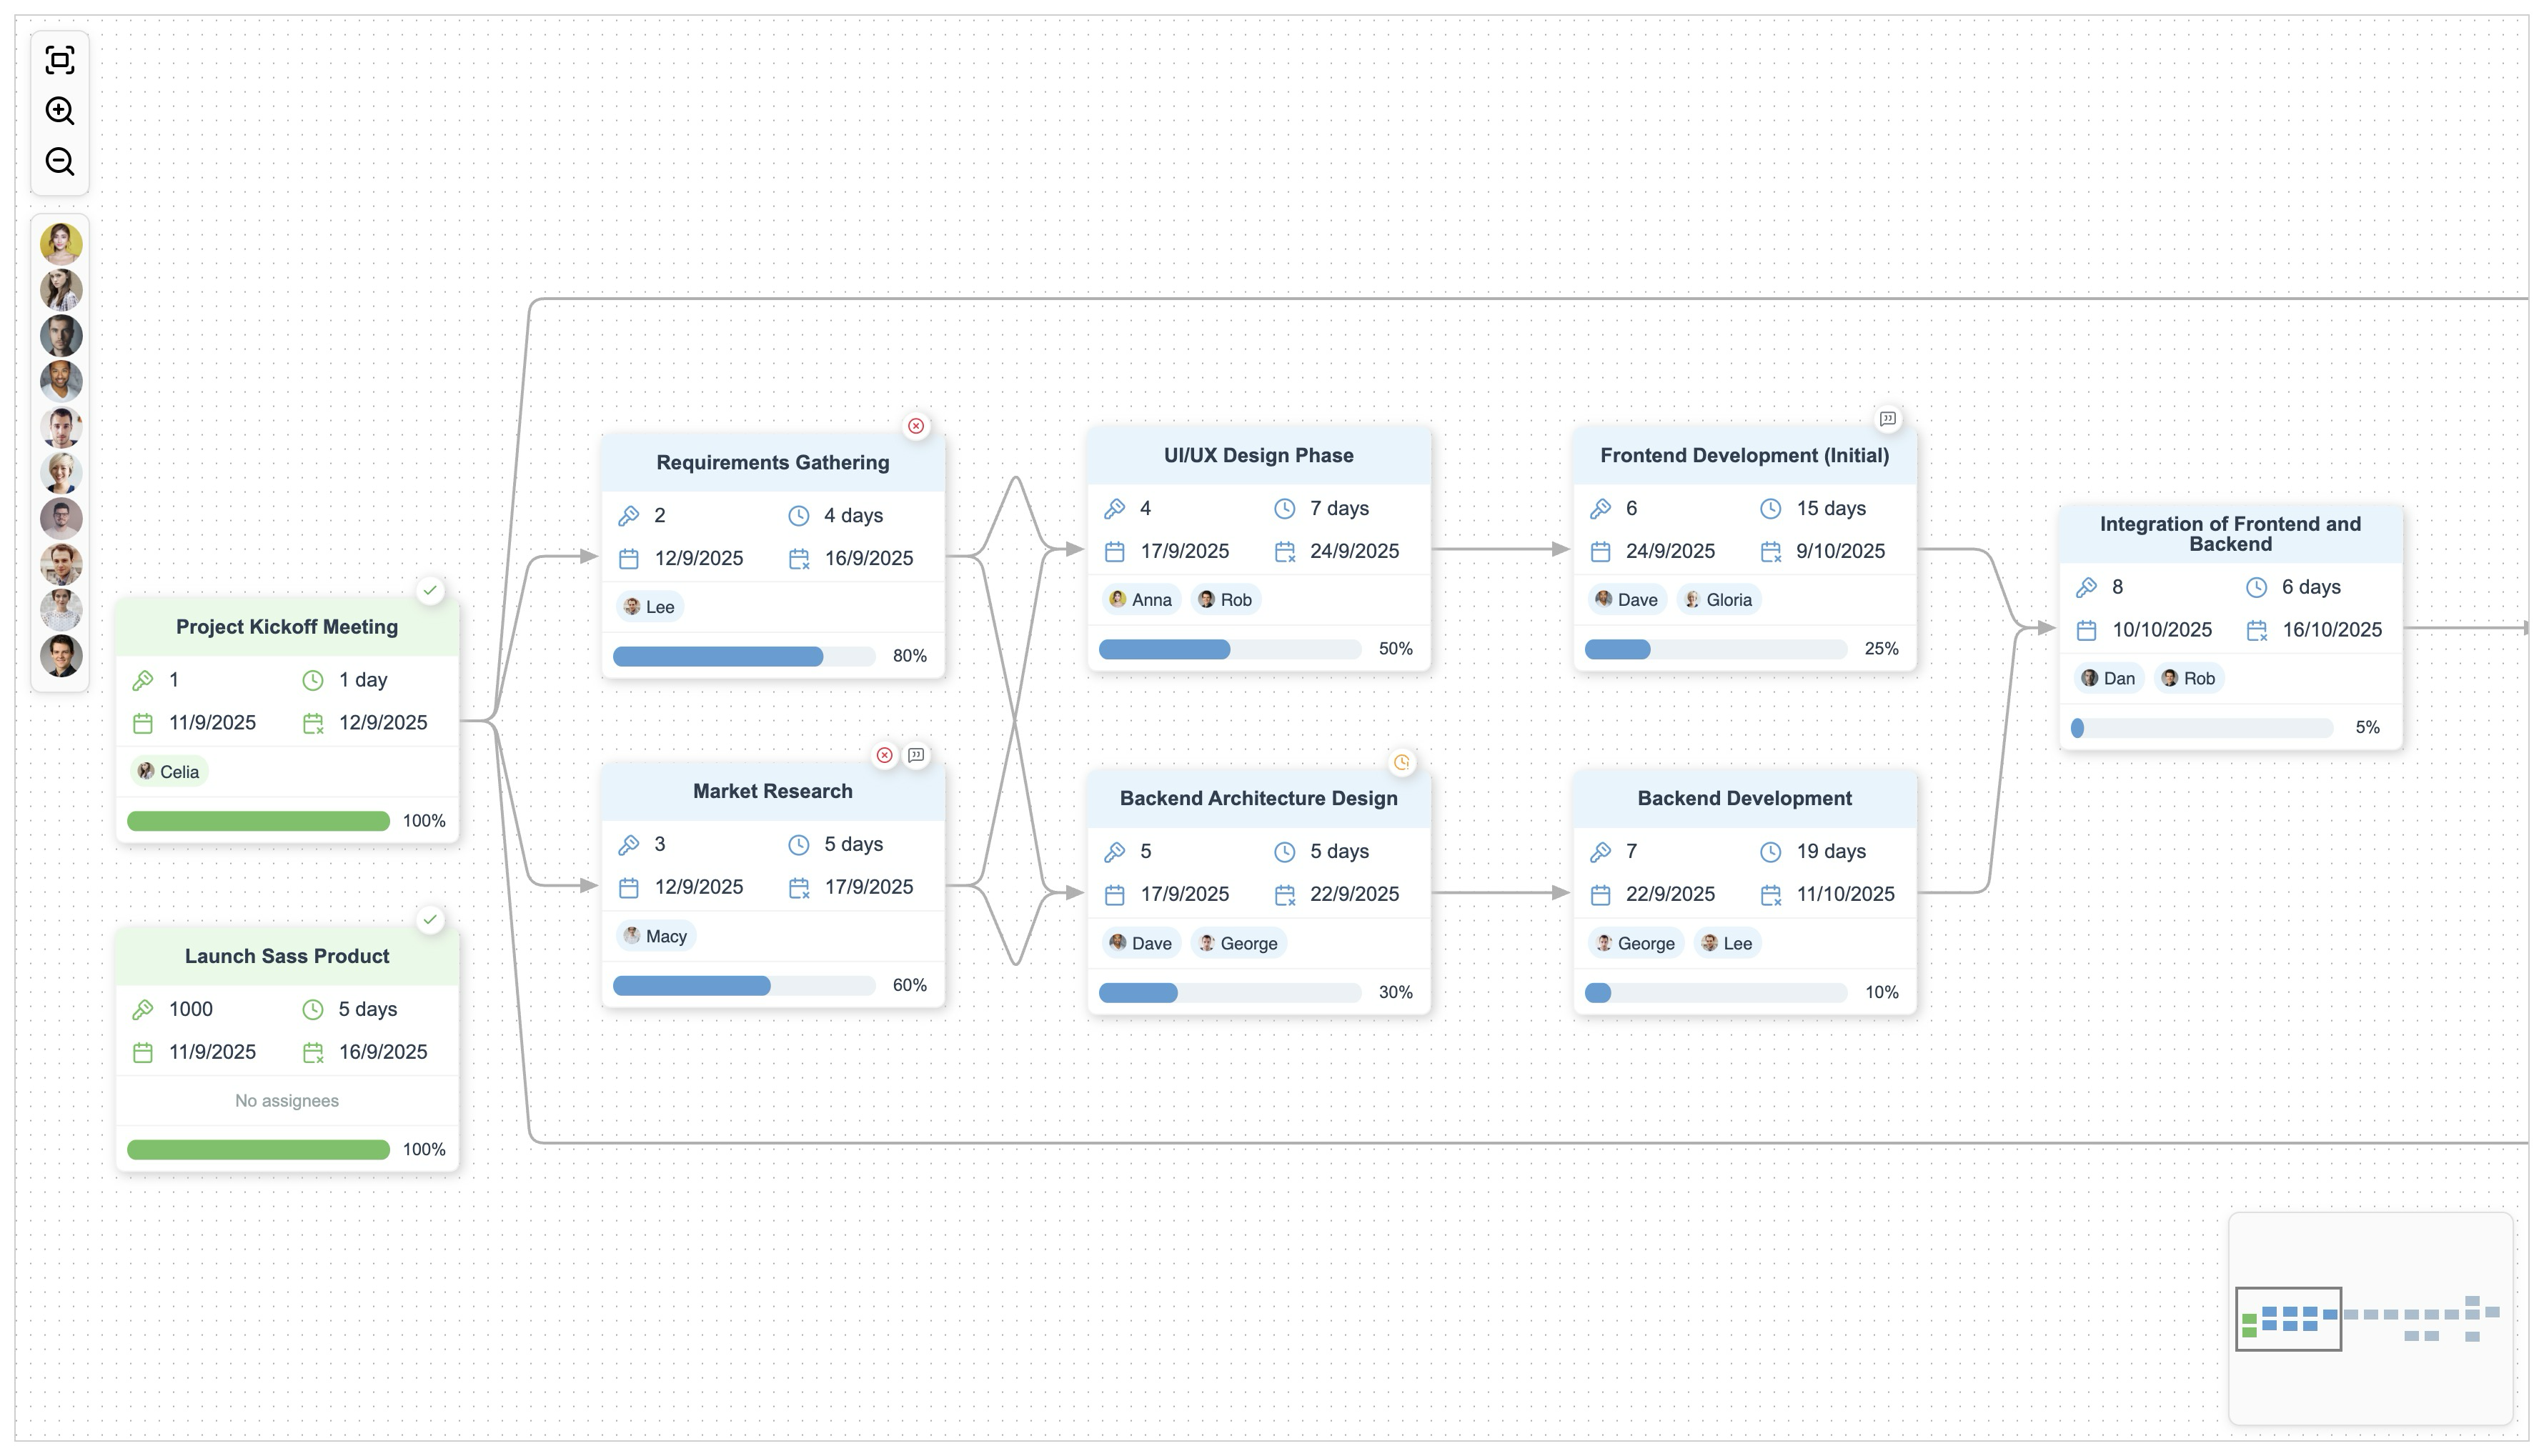
Implementation details...
- The example is encapsulated within a class that provides options and events, making it easy to integrate with other applications. See the Bryntum collaboration example for reference.
- Dragging resources from the element palette and between shapes is handled using the Stencil feature.
- The shape used in this example is a custom Record shape.
- The
assigneesandbadgesshape decorators are implemented as custom highlighters. - Cells generated from data are applied to the graph using the
graph.syncCells()method.
Timeline
apps.Timeline - add new app
This timeline demo not only takes you back in time and highlights key milestones for OpenAI and Anthropic, but also showcases advanced diagramming features available in JointJS+. Navigate the timeline using zoom and pan, delete events, and add new ones to reshape the history of leading AI companies.
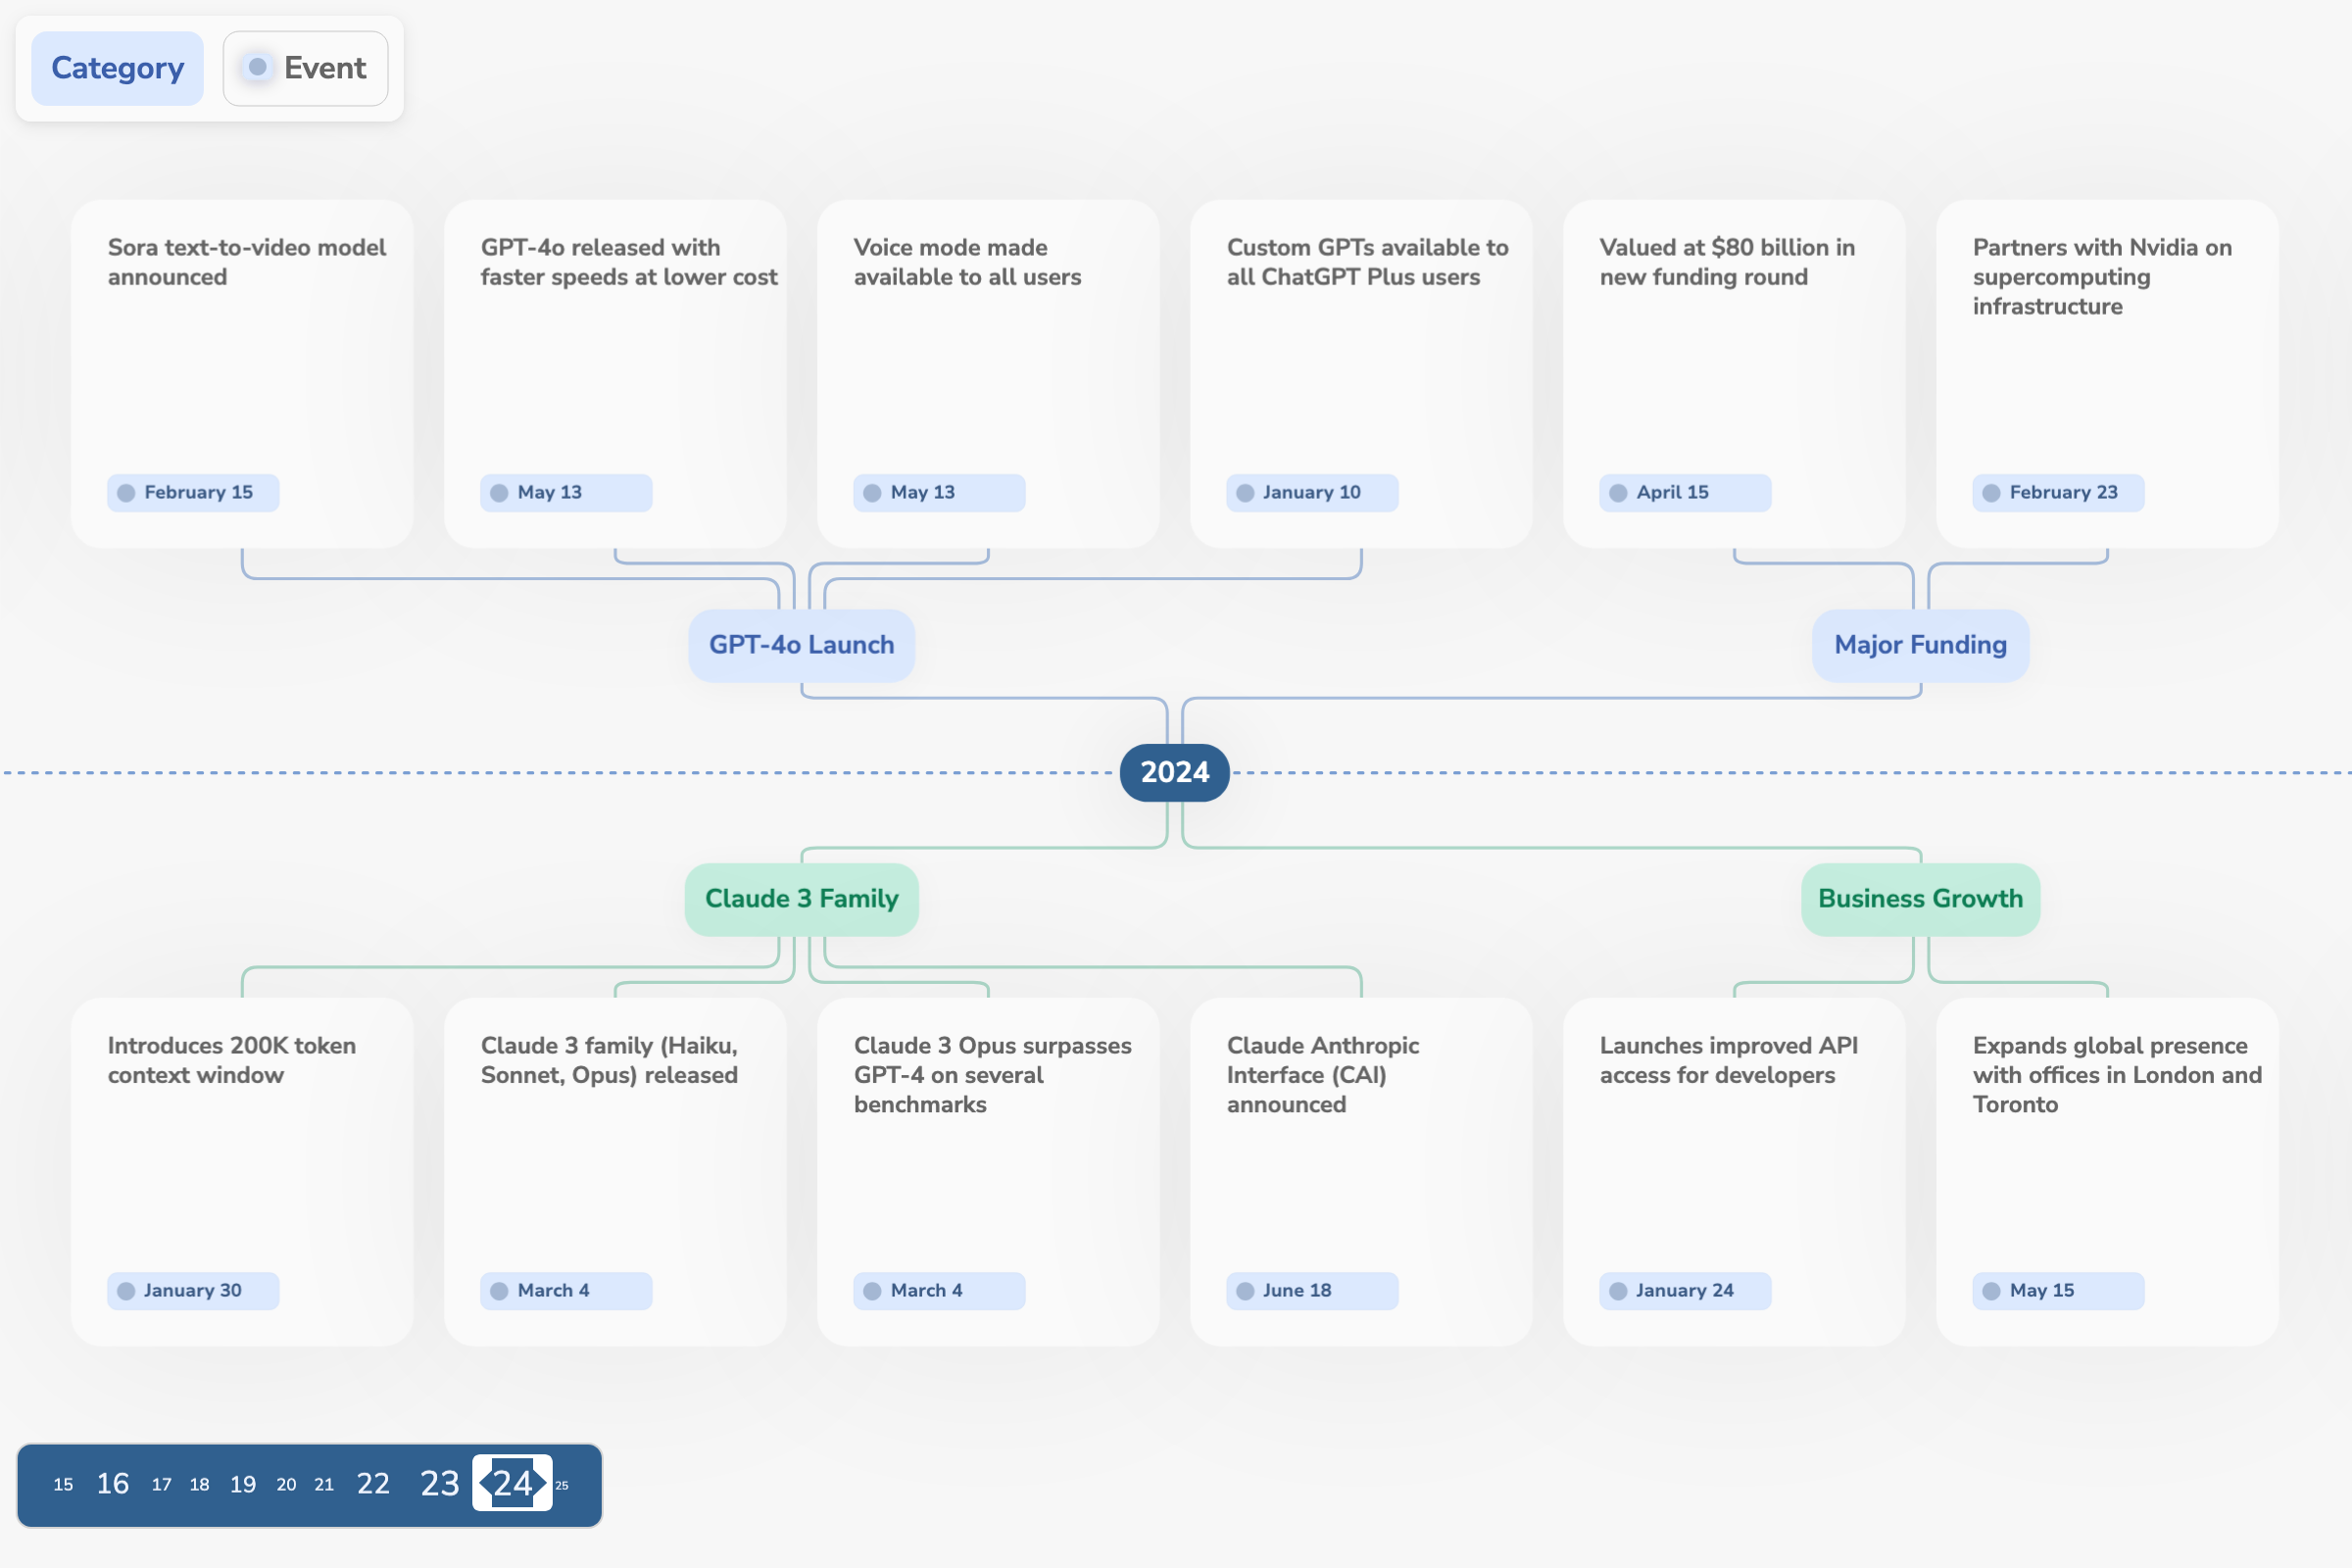
Implementation details...
- Arranges a forest of trees using the TreeLayout and its new
positionTree()method. - Implements custom routing for parallel links within the tree layout.
- Enhances the drag-and-drop experience with the new
snapToClosestElementandfallbackToAncestorTreeLayoutViewoptions. - The Navigator uses a custom element view that scales element sizes based on the number of their children.
ELK Automatic Layout
add new ELK layout example
The new ELK layout example is written in TypeScript and illustrates how the powerful Eclipse Layout Kernel (ELK) library can be used with JointJS to layout an existing diagram.
// Run ELK layout on the existing graph
elk.layout(getElkGraph(graph)).then((elkGraph: ElkGraph) => {
    updateGraph(elkGraph, graph);
});
The complete source code is available on GitHub.
Live ELK Automatic Layout example
format
Visio
format.Visio - fix formula parsing to accept scientific notation
Previously, our Visio import formula parsing regular expression was removing all letters from the formula, including the letter E
of scientific notation. We now correctly remove only the formula name itself.
format.Visio - fix image import to support cropping and hiding when size is 0, 0
We improved how images are imported from Visio files. Images are now wrapped in a <symbol> with a defined viewBox, enabling support for image cropping via imgOffsetX and imgOffsetY.
Because the <image> element now uses the Visio imgWidth and imgHeight properties, images with size 0,0 are correctly hidden.
ui
FreeTransform
ui.FreeTransform - fix to prevent browser zoom on wheel event at a FreeTransform box/handle
We now correctly capture the 'wheel' event at a FreeTransform box/handle and process it with the JointJS zoom handler in order to prevent the default browser zoom action.
Halo
ui.Halo - fix to prevent browser zoom on wheel event at a Halo handle
We now correctly capture the 'wheel' event at a Halo handle and process it with the JointJS zoom handler in order to prevent the default browser zoom action.
ui.Halo - fix to remove forks and clones that violate validateUnembedding() callback
Previously, forking and cloning elements from Halo did not revert the graph state in case of the paper.options.validateUnembedding() callback returning false.
We now remove the element when the element is not allowed to exist (e.g. outside of its parent). This makes the behavior of Halo consistent with the behavior of the Stencil component.
Try forking or cloning the element in the demo below, then move the new element outside the parent bounds to see it removed.
Inspector
ui.Inspector - trigger model start/stop batch event on model update for non-Cell models
The CommandManager will now correctly batch changes done via the Inspector on any model (not only on Cells inside a Graph).
Previously, when a change was done via the Inspector, we would only trigger 'batch:start' / 'batch:stop' events on the Graph that the cell was part of.
Keyboard
ui.Keyboard - fix isActive() method when first parameter is an invalid descriptor
For this version, we fixed the behavior of the keyboard.isActive() method so that it returns true if a modifier key ('alt', 'ctrl', 'shift', 'command') is being pressed at the same time, and false otherwise, as expected.
Details...
Previously, the method was returning true also when an invalid modifier key descriptor (e.g. 'aalt') was provided (regardless of any key being pressed), which could lead to subtle errors.
Navigator
ui.Navigator - add dynamicZoom option
We now support dynamic zooming of the Navigator with the dynamicZoom option. When this option is active, the minimap automatically resizes to include the user's viewport, even when there are no elements.
Try the interactive demo below. It shows two Navigators bound to the same PaperScroller: the left one with dynamicZoom: false, the right one with dynamicZoom: true. Pan/zoom the paper or use the buttons and compare how each minimap reacts.
ui.Navigator - optimize resize update when aspect ratio of source paper is preserved
We now skip Navigator updates for Paper resize events where the aspect ratio is preserved, which improves the rendering performance of large diagrams (thousands of cells).
Details...
Previously, a Navigator update was triggered for every resize event on the source paper. However, this was unnecessary in the cases where the aspect ratio of the source paper was preserved, since such a resize leads to no visible change in the minimap.
ui.Navigator - fix to account for borders in paper dimensions calculation
The Navigator component now correctly accounts for the border size of its HTML element when calculating the dimensions of its contained paper element.
Details...
Previously, the paper element inside the Navigator was trimmed by the size of the border, either horizontally or vertically.
| Before fix | After fix |
|---|---|
 |  |
PaperScroller
ui.PaperScroller - add virtualRendering option to enable rendering only in-viewport cells
To maximize performance and reduce memory usage in large diagrams, it's important to keep the number of DOM nodes low. The new virtualRendering option automatically limits the number of rendered cell views by:
- Initializing CellViews lazily, only when they are needed.
- Rendering views only when they enter the viewport, prioritizing their display through adding them to the top of the rendering queue.
- Hiding views when they leave the viewport, either detaching them from the DOM or removing them entirely from memory.
For best results:
- enable
autoFreezeto avoid unnecessary render loops - and
viewManagement.disposeHiddento remove out-of-viewport views from the memory.
Additional settings allow you to adjust the virtual rendering behavior according to your needs:
margin- This option allows you to specify a buffer area for cell rendering so that cells around the viewport are ready when the user scrolls.cellVisibility- This option allows you to provide additional logic for cell visibility evaluation, on top of the intrinsicIs the cell inside the current viewport?
check.prioritizedCellVisibility- This option prioritizes cell views that appear in the viewport over those that leave it, improving perceived performance. Enabled by default. For best results, use it alongside with SearchGraph.
This option requires the wrapped paper to be async and have viewManagement enabled.
See below for an introduction to the viewManagement Paper option.
The interactive demo below renders a large grid of elements connected with links and enables virtualRendering. As you zoom and pan around the diagram, notice the count of rendered cells in the top-right corner. Only in-viewport cell views are mounted, and cell views are progressively unmounted as they find themselves outside of the visible area.
If you are currently using a custom view management solution with the viewport() Paper option, we recommend you switch to an out-of-the-box solution with PaperScroller's virtualRendering and Paper's viewManagement options:
- Before
- After
const paper = new dia.Paper({
    model: graph,
    // ...
    async: true,
    viewport: function(view) {
        const model = view.model;
        if (!model) return true;
        if (model.isHidden()) return false;
        return viewportRect.intersect(bbox);
    }
});

const paperScroller = new ui.PaperScroller({
    paper: paper,
    // ...
});

// ...

const viewportOverlap = 50;
let viewportRect = paperScroller.getVisibleArea().inflate(viewportOverlap);
paperScroller.el.onscroll = function() {
    viewportRect = paperScroller.getVisibleArea().inflate(viewportOverlap);
};
paper.on('scale', function() {
    viewportRect = paperScroller.getVisibleArea().inflate(viewportOverlap);
});
const paper = new dia.Paper({
    model: graph,
    // ...
    async: true,
    autoFreeze: true,
    viewManagement: true
});

const paperScroller = new ui.PaperScroller({
    paper: paper,
    // ...
    virtualRendering: {
        margin: 50,
        cellVisibility: (model) => !model.isHidden()
    }
});
ui.PaperScroller - add useGraphEvents setting to autoResizePaper option
When the autoResizePaper option is enabled, the PaperScroller normally resizes the paper after the 'render:done' event.
const paperScroller = new ui.PaperScroller({
    paper,
    autoResizePaper: { graphEvents: true }
});
With the new useGraphEvents option, the paper is instead resized in response to graph events: 'add', 'remove', 'change', and 'reset'.
This option is useful in scenarios where you are expecting a lot of 'render:done' paper events to be triggered which do not affect the size of the wrapped paper (for example, monitoring applications where cells/highlighters are frequently changing).
The graphEvents is enforced when virtualRendering is active.
ui.PaperScroller - add overscroll-behavior: contain rule to CSS
The default PaperScroller CSS now prevents default browser behaviors like scroll chaining and horizontal swipe navigation when the user scrolls to the edge of the paper scroller, since those behaviors are not desired in the majority of use cases.
ui.PaperScroller - fix center calculations when center() is called without parameters
We fixed a mistake in the center() method when it was called with no parameters. It now correctly centers the PaperScroller to the center of the wrapped paper.
ui.PaperScroller - fix paper CSS position style
This release resolves issues with improper positioning of the wrapped paper inside PaperScroller when text-align and direction styles were applied on the PaperScroller element.
Details...
Previously, the absolute position style (from PaperScroller CSS styles) was getting overridden by Paper's inline relative position style. We now make sure to apply the absolute position to the wrapped paper as well.
Selection
ui.Selection - fix to only consider selected elements for restrictTranslate Paper option
For this release, we fixed the behavior of Selection when a group of selection is dragged by the user while Paper.options.restrictTranslate option is active, so that only the selected elements are considered toward the restriction.
Details...
Previously, all cells in the Graph (even unselected elements) were considered toward the restriction by mistake.
ui.Selection - fix to prevent browser zoom on wheel event at a Selection box/handle
We now correctly capture the 'wheel' event at a Selection box/handle and process it with the JointJS zoom handler in order to prevent the default browser zoom action.
Stencil
ui.Stencil - add hostEl option to allow specifying an alternative behind-stencil area
The new Stencil hostEl option allows you to specify that a specific HTMLElement should act as the behind-stencil area for the purposes of determining the drop area.
That is, when an element is dragged from a stencil, the area behind hostEl will not be considered as a valid drop target - the dragging action will be cancelled if an element is dropped there, similar to what happens when a shape is dropped outside of the paper.
This is useful in situations where the Stencil functionality is used without the JointJS+ Stencil being rendered, like in our Custom Stencil demo:
ui.Stencil - add CSS variable for setting paper drag opacity
Previously, the opacity of the paper drag
(the element preview as the user drags it from the stencil to the paper) had a fixed value of 0.7.
Since not every application requires paper drag transparency, we added a new CSS variable --jj-stencil-paper-drag-opacity, which makes it easy to change the value:
:root {
    --jj-stencil-paper-drag-opacity: 1;
}
ui.Stencil - fix to always snap to paper grid on drop
This release resolves a regression regarding the drag-and-drop functionality of Stencil. Dropped elements are now again always snapped to paper grid.
Details...
Stencil previously used to snap elements to paper grid on drop, but one of the past versions changed this behavior to only do so if the usePaperGrid option was enabled. However, that was a mistake.
The usePaperGrid option is now again only used for dragged elements, as documented.
TreeLayoutView
ui.TreeLayoutView - add fallbackToAncestor option
The new fallbackToAncestor option determines what should happen when a drop attempt has no valid target at the current drag coordinates.
const treeLayoutView = new ui.TreeLayoutView({
    paper,
    fallbackToAncestor: true // or false, or a callback function
});
The option can take three types of values:
- When
false, the dropping fails (no drop preview is shown). - When
true, JointJS climbs up the ancestry chain of the current drop target and stops at the first ancestor that satisfies allvalidateConnection()rules. The ancestor is used as the parent of the dropped element. If no valid ancestor is found, the dropping fails. - Providing a callback function gives you full control over the fallback behavior. The callback is expected to return an element to be used as the new parent of the dropped element, or
nullif the dropping is supposed to fail.
ui.TreeLayoutView - add snapToClosestElement option
The new snapToClosestElement option controls whether a dragged element should snap to the geometrically closest element in the direction of the layout.
const treeLayoutView = new ui.TreeLayoutView({
    paper,
    snapToClosestElement: { radius: 150 }
});
Here is a diagram illustrating the difference between the default parent selection (the child is connected to the Root element of the layout area the user is dragging over) and the Closest element selection. The "closest" feels more natural and will most likely become a new default in future versions.
shapes
bpmn2
shapes.bpmn2 - fix URL handling for custom icons
We fixed the URL handling for custom icons in BPMN2 shapes by properly distinguishing between SVG strings and URLs. The fix ensures that SVG strings are converted to data URIs while preserving URLs and data URIs as-is.
Details...
For example, when adding a custom activity type icon, we are able to correctly handle both cases:
shapes.bpmn2.Activity.ACTIVITY_TYPE_ICONS['myIconFile'] = `${process.env.PUBLIC_URL}/assets/myIcon.png`;

shapes.bpmn2.Activity.ACTIVITY_TYPE_ICONS['myIconSVG'] = `<svg width="40" height="45" version="1.1" xmlns="http://www.w3.org/2000/svg"><polygon points="20 0 25 20 40 20 30 30 35 45 20 35 5 45 10 30 0 20 15 20" stroke="green" fill="transparent" stroke-width="5"/></svg>`;
layout
DirectedGraph
layout.DirectedGraph - support clusterPadding: 'default'
In this release, we add support for opt.clusterPadding: 'default' option in DirectedGraph.layout() method, which applies default Dagre padding logic for clustered elements.
When this option is active, Dagre automatically reserves space for elements with nested children so that the element does not overlap other elements of the diagram, at the cost of not being able to specify a custom value for padding:
DirectedGraph.layout(graph, {
    clusterPadding: 'default'
});
On the flip side, a large cluster padding or multiple nesting levels can currently cause containers to overlap other elements.
layout.DirectedGraph - expose Dagre disableOptimalOrderHeuristic and customOrder options
We now expose two Dagre options disableOptimalOrderHeuristic and customOrder through the DirectedGraph.layout() method. These options are useful when you need diagram elements to be laid out in a specific way.
const elements = graph.getElements();
const sortedLinks = util.sortBy(
    graph.getLinks(),
    (link) => { /* return a sibling index */}
);

DirectedGraph.layout([...elements, ...sortedLinks], {
    disableOptimalOrderHeuristic: true,
});
The order of siblings in a DirectedGraph can be influenced by the order of links in the graph, not by the order of elements.
Details...
By default, Dagre optimizes the layout so that the number of link crossings is minimized, and in order to do so, Dagre makes no promises about the way elements will be placed in the final layout. Furthermore, even if Dagre decides to keep the order you want by chance, it may reshuffle your elements when the graph is modified (i.e. an element is added/removed).
Having a stable layout is a common requirement though, and that is where the disableOptimalOrderHeuristic Dagre option comes in. When it is active, Dagre respects the order in which links are passed in, and places elements accordingly - this allows you to affect the layout by strategically reordering diagram links (e.g. to lay elements out alphabetically according to their labels, the links you pass to Dagre should be sorted according to their target's labels).
As you can see, disableOptimalOrderHeuristic offers some control over the layout while keeping the ordering algorithm mostly intact. If that is not enough for your use case, you may experiment with the advanced customOrder option instead, which lets you replace the ordering algorithm completely.
See the Dagre repository for more information about the two options.
The interactive example below shows the difference between the default Dagre layout and the disableOptimalOrderHeuristic layout with elements ordered alphabetically by their labels.
ForceDirected
layout.ForceDirected - allow radialForceStrength option to be defined as a function
We have made it possible to define the radialForceStrength option as a function. This is particularly useful when you want radial forces to be applied only under certain conditions, such as when two elements overlap:
Implementation details...
The animations are done using CSS transitions. They run the layout synchronously. When the engine cools down and the final positions are known, we...
- ...add CSS stylesheet to the paper:
const animationStyleNode = V.createSVGStyle(`
    .joint-element {
        transition: transform 0.2s ease-out;
    }
`);
paper.defs.appendChild(animationStyleNode); - ...set the final positions to the elements (this triggers the CSS transitions):
element.position(finalX, finalY);
When the user starts dragging an element, we remove the CSS stylesheet to prevent the transitions from interfering with the drag operation:
animationStyleNode.remove();
MSAGL
layout.MSAGL - add new layout package utilizing the Microsoft Automatic Graph Layout
The new @joint/layout-msagl package helps you arrange either an entire JointJS graph or a specified subset of cells using the Microsoft Automatic Graph Layout (MSAGL).
Here are some of the key features of the MSAGL layout engine:
- Hierarchical layout: Uses the Sugiyama algorithm for layered graph layout.
- Nested subgraphs: Supports elements with embedded children as subgraphs.
- Edge routing: Rectilinear or SplineBundling edge routing modes.
- Customizable callbacks: Control how layout results are applied to elements.
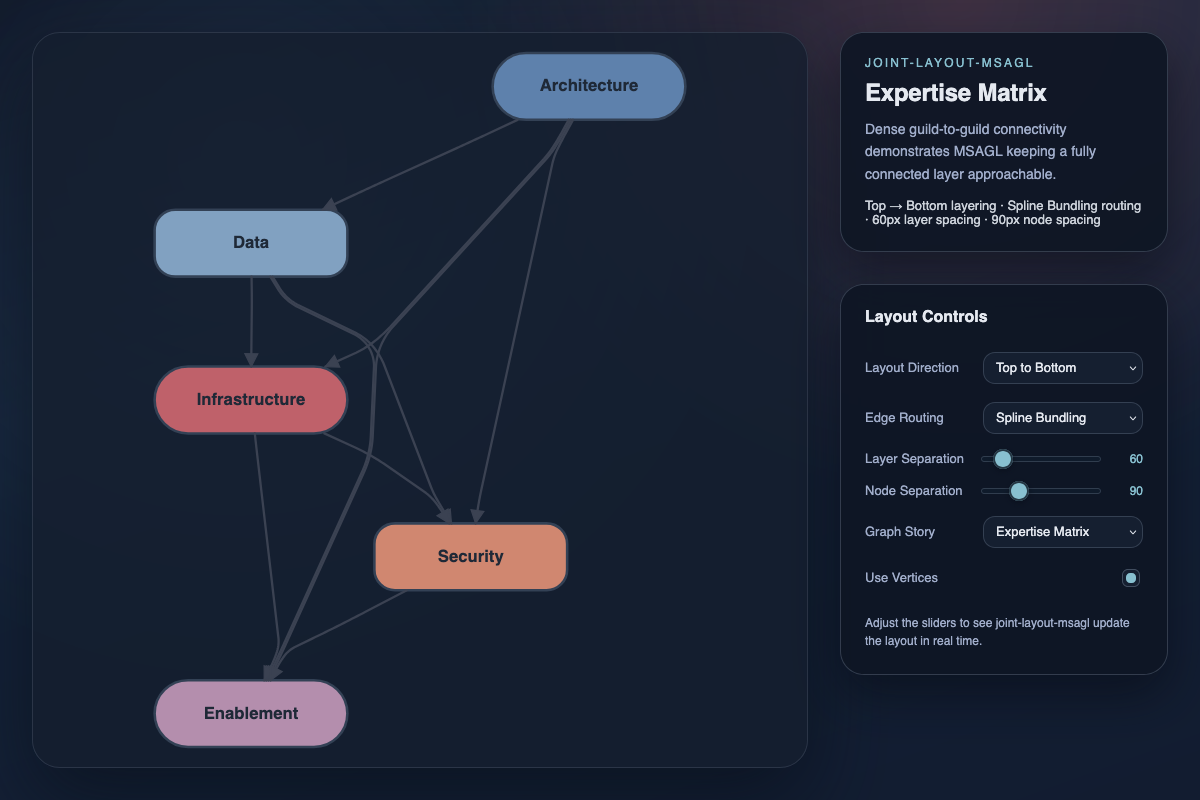
See the live MSAGL example showcasing the MSAGL layout engine in action with animations and various configuration options.
TreeLayout
layout.TreeLayout - add positionTree() method
The new positionTree() method of TreeLayout moves an already-laid-out tree to a new absolute position while preserving the relative arrangement of all its children.
// Layout a forest and position each tree separately.
const tree = new TreeLayout(/* ... */);
tree.layout();
graph.getSources().forEach((treeRoot, index) => {
    // Position each tree 200px apart horizontally.
    tree.positionTree(treeRoot, 200 * index, 0);
});
dia
CommandManager
dia.CommandManager - support arbitrary mvc.Model as root model
We now support passing an arbitrary mvc.Model as root model of a CommandManager object (instead of only dia.Graph objects).
dia.CommandManager - support element type change
We updated the CommandManager to support the new graph.syncCells() method, enabling users to replace a cell with another model (i.e. change its type).
See below for more information.
Details...
Internally, the changing of the type of a cell within a batch is handled with a special 'replace' command. It combines a 'remove' command with an 'add' command (plus any preceding/following 'change' commands) as a single action.
dia.CommandManager - fix to properly manage property unsetting on undo/redo
The CommandManager now correctly unsets added properties on undo, and correctly re-unsets properties on redo.
Details...
Previously, if a new property was initialized on a model and then the initialization was undone with CommandManager, the result was that the property was left over on the model with a value of undefined. The CommandManager now correctly unsets these properties (i.e. leaving nothing on the model).
const graph = new dia.Graph();
const commandManager = new dia.CommandManager({ model: graph });
// initial graph properties = `{}`

graph.set('test1', 1);
// graph properties = `{ test1: 1 }`
commandManager.undo();
// graph properties = `{}`
// - PREVIOUSLY `{ test1: undefined }` (INCORRECT)
Similarly, if an existing property was unset on a model and then the unsetting was undone + redone with CommandManager, the result would be that the property would be left over on the model with a value of undefined. The CommandManager now correctly returns to the original state (i.e. leaving nothing on the model).
const graph = new dia.Graph({ test2: 2 });
const commandManager = new dia.CommandManager({ model: graph });
// initial graph properties = `{ test2: 2 }`

graph.unset('test2');
// graph properties = `{}`
commandManager.undo();
// graph properties = `{ test2: 2 }`
commandManager.redo();
// graph properties = `{}`
// - PREVIOUSLY `{ test2: undefined }` (INCORRECT)
dia.CommandManager - fix default cmdNameRegex option to accept any property name
Previously, changes to attributes with - character in the name (such as graph.set('312321-312312', 'value');) were not registered by CommandManager due to overly restrictive regex. Now, all valid JavaScript object property keys are accepted.
Validator
dia.Validator - add addRule() and removeRule() methods
We added new addRule() and removeRule() methods to the Validator class to provide a better API design for managing validation rules:
addRule()- Adds a validation rule to one or more actions.removeRule()- Removes specific validation rule(s) from one or more actions.clearRules()- Remove all validation rules from all actions.
This new API supersedes the now-deprecated validate() method.
Since validate() is inherited from mvc.Model, its original purpose will be reinstated in a future release.
SearchGraph
dia.SearchGraph - add has*AtPoint() and has*InArea() methods
We have added a collection of has*AtPoint()/has*InArea() methods to the SearchGraph API, as more efficient counterparts to find*AtPoint()/find*InArea() methods for the case when you just need to determine whether there is something
at a given point/in a given area (and you do not need to know what that something
is, specifically):
Full list of changes...
Cells:
hasCellsAtPoint()-Is there at least one cell at a given point?
, comparefindCellsAtPoint().hasCellsInArea()-Is there at least one cell in a given area?
, comparefindCellsInArea().
Elements:
hasElementsAtPoint()-Is there at least one element at a given point?
, comparefindElementsAtPoint().hasElementsInArea()-Is there at least one element in a given area?
, comparefindElementsInArea().
Links:
hasLinksAtPoint()-Is there at least one link at a given point?
, comparefindLinksAtPoint().hasLinksInArea()-Is there at least one link in a given area?
, comparefindLinksInArea().
dia.SearchGraph - add setQuadTreeIndexFilter() method
We introduced an index filter feature for the SearchGraph class that allows filtering which cells are included in the quad tree index. The filter enables selective indexing based on custom criteria (e.g. cell visibility), while providing an option to bypass the index when needed (see below).
Use the setQuadTreeIndexFilter() method to control which cells are indexed - cells which are not indexed are not considered by any subsequent SearchGraph find*() nor has*() function calls (e.g. findCellsAtPoint(), hasLinksInArea()). For example:
const graph = new dia.SearchGraph({}, { cellNamespace: shapes });

const isCellLayerVisible = (cell) => {
    const layer = graph.getLayer(graph.getCellLayerId(cell));
    // return `true` if cell's layer is visible
    return !layer.get('hidden');
};

const paper = new dia.Paper({
    model: graph,
    cellViewNamespace: shapes,
    async: true,
    cellVisibility: isCellLayerVisible
});

searchGraph.setQuadTreeIndexFilter(isCellLayerVisible);
dia.SearchGraph - add useIndex option to find*() and has*() methods
In addition to introducing an index filter functionality (see above), we also added the useIndex boolean option to all SearchGraph find*() and has*() methods (e.g. findCellsAtPoint(), hasLinksInArea()) to bypass the index when needed. For example:
searchGraph.setQuadTreeIndexFilter((cell) => {
    // only consider elements which don't have a specific property
    return !cell.get('hidden');
});

// ...

// e.g. if we want to prevent dropping an element over a hidden element
const invalidate = searchGraph.hasElementsInArea(dropArea, { useIndex: false });
dia.SearchGraph - fix to propagate strict value to quad tree subdivisions
We fixed the SearchGraph logic to properly handle the strict option in all cases.
Details...
Previously, we did not correctly propagate the strict value to subdivisions when checking if a rectangle in question lies inside a given rectangle in the quad tree (i.e. Is the rectangle in question fully contained within a given rectangle?
).
This meant that (unless there were no subdivisions in the quad tree area in question), all SearchGraph find*InArea() and has*InArea() queries (e.g. findElementsInArea(), hasLinksInArea()) were performed non-strictly (i.e. Does the rectangle in question overlap a given rectangle?
).
dia.SearchGraph - fix quad tree re-indexing in eager mode
We fixed the process of registering and updating cells in the eager mode of SearchGraph. Changed cells are now properly re-indexed on change.
Details...
In SearchGraph's eager mode (the default), the quad tree is never completely invalidated and recreated from scratch. Instead, it is incrementally updated by re-indexing each changed cell as changes happen to it (i.e. removing it and adding it back to the quad tree).
This process was previously failing because cells were initially not registered correctly, so they could not be found and removed by the SearchGraph later.
dia.SearchGraph - fix to properly index links with a zero dimension
Completely horizontal links have a height of 0, and completely vertical links have a width of 0. Previously, SearchGraph mistakenly skipped the indexing of these links. We fixed the indexing functionality for the new release.
dia.SearchGraph - optimize quad tree querying performance
To improve the querying performance of SearchGraph for large diagrams (thousands of cells), we optimized the most exposed areas of its code.
Details...
- We replaced all recursion in quad tree traversal methods with loop-based traversals using an explicit stack.
- We refactored
forEachloops toforloops (over 10% performance gain for large diagrams). - We replaced inline filter callbacks with dedicated static methods.
Paper
dia.Paper - introduce layers API
In this release, we introduced support for organizing cell views into multiple layers within dia.Paper (with related changes in dia.Graph and dia.Cell).
All SVG content inside dia.Paper is rendered within its layers container, which holds multiple layers stacked in a defined order.
Some of these are graph-layer views, each backed by a model with its own cell collection and independent z-index stacking context.
Previously, only a single graph layer was supported; this is now represented by the default cell layer.
The default cell layer which existed in previous version has the ID 'cells' by default. You can switch the default cell layer to another layer with graph.setDefaultLayer().
When you add a cell to a graph without specifying its layer, it is added to the default cell layer.
You can now add any number of layers to the Graph to supplement the default layer. All layers are instances of dia.GraphLayer class. Layers defined on a Graph are rendered in an associated Paper as special views in the order specified in the Graph's layerCollection.
Besides adding a layer as a dia.GraphLayer instance, you can also add it as a JSON object (similar to how cells are processed). To inform Graph which types to use when constructing new instances, the layerNamespace Graph option is used (by default, the dia.GraphLayer type is used).
New cell layers are created in Paper automatically - for every dia.GraphLayer added to the Graph, a corresponding dia.GraphLayerView is created. All cell layer views are placed between 'back' and 'labels' layer views. The type of a view corresponding to a graph layer model is automatically deduced from the graph layer's type (similar to how the Paper creates dia.CellView instances based on the cellViewNamespace). For example, if the layer added to a Graph has type CustomGraphLayer, the associated Paper will look for CustomGraphLayerView type in layerViewNamespace.
To assign a cell to a layer, use the new cell.layer() method. You can set the layer when creating the cell or change it later. If no layer is specified, the cell is placed in the default layer.
The layer ID is stored in the attribute defined by layerAttribute (default: layer). For example, to place a cell in layer 'layer_1':
const element = new dia.Element({
    layer: 'layer_1',
    // ... other attributes
});
The layers are exported as part of the diagram's JSON representation. When a diagram is loaded from JSON, all layers and their contents are restored automatically.
{
    "cells": [
        // ... cell definitions
    ],
    "defaultLayer": "base",
    "layers": [
        {
            "id": "background",
            "locked": true,
            "hidden": false
        },
        {
            "id": "links",
            "locked": true,
            "hidden": false
        },
        {
            "id": "base",
            "name": "Base",
            "hidden": false
        }
    ],
}
The Graph JSON is backward compatible:
- Diagram JSON's without
layersload with a single default layer containing all cells. - Layers are omitted from exported JSON if the Layers API was not used.
Full list of changes...
dia.Paper:
We added multiple methods to dia.Paper for manipulating layer views:
- You can add new layer view using the
addLayerView()method. This method adds layer view instance to thedia.Paper. It will also injectpaperreference to the layer view. If no options are provided, the layer view is added to the end of thelayerselement. To position the layer view in a specific place, you can use eitherbeforeorindexoptions. - You can move layer views to a different position in the paper using the
moveLayerView()method. If no options are provided, the layer view is added to the end of thelayerselement. To position the layer view in a specific place, you can use eitherbeforeorindexoptions. - You can synchronously remove (empty) layer views from the paper with the
removeLayerView()method. It will throw an error if you try to remove a non-empty layer view. - To get an ordered array of all layer views in the paper, you can use
getLayerViews(). Alternatively, if you only need to check whether a layer view with a given ID exists, usehasLayerView(). - If you need an array of specifically graph layer views in the paper, you can use
getGraphLayerViews()instead. - You can access a layer view with
getLayerView(layerRef)by passing either the layer ID or itsdia.GraphLayermodel.
dia.GraphLayerView:
We added a view (inheriting from dia.LayerView) which is responsible for inserting cell views into the correct place in the DOM according to z-index values of items inside the corresponding dia.GraphLayer. An instance of this class is automatically created by the Paper when a dia.GraphLayer is added into the Graph - from then on, it represents the graph layer within the Paper.
dia.GridLayerView:
We exposed a standalone view (inheriting from dia.LayerView) which is responsible for rendering the Paper grid. An instance of this class is automatically created by the Paper.
dia.LayerView:
We exposed a generic view (inheriting from mvc.View) to represent a layer view within a Paper. It is a standalone view (i.e. it can be used without a model), which can position and render arbitrary SVG elements within a Paper in an ordered way.
dia.Graph:
We added multiple API methods to dia.Graph to support layers functionality:
- You can add a new layer using the
addLayer()method. When usingaddLayer()without additional options, the layer is added to the end of the Graph'slayerCollection:You can usegraph.addLayer({
id: 'layer_1'
});beforeorindexoption to add the layer at another position:The layer can be added as agraph.addLayer({
id: 'layer_1',
before: 'layer_2'
});dia.GraphLayerinstance or as a JSON object. When adding a layer as a JSON object, thelayerNamespaceGraph option is used to determine which type to use when constructing the new instance (by default, thedia.GraphLayertype is used). - You can move an existing layer to a different position in the
layerCollectionusing themoveLayer()method. If no options are provided, the layer is added to the end of thelayerCollection. To position the layer in a specific place, you can use eitherbeforeorindexoptions. - You can remove a cell layer from the graph with the
removeLayer()method. The default cell layer cannot be removed. A layer with cells cannot be removed - you must first move or remove all cells from the layer. - To get an array of all cell layers, use
getLayers(). If you only need to check whether a cell layer with a given ID exists, usehasLayer(). - If you need to get a specific layer from the graph, use the
getLayer(layerId)method. - You can get the default layer of the graph with the
getDefaultLayer()method. You can change which layer is considered the default with thesetDefaultLayer()method. - To get layer ID of a particular cell, use the new
getCellLayerId(cell)method.
We also changed the behavior of several Graph functions to take layers into account:
- When
getFirstCell()is called without arguments, it returns the first cell of the first layer (according to the ordering oflayerCollection). When a layer ID is provided (e.g.getFirstCell(layerId)), the first cell of the given layer is returned. - When
getLastCell()is called without arguments, it returns the last cell of the last cell layer (according to the ordering oflayerCollection). When a layer ID is provided (e.g.getLastCell(layerId)), the last cell of the given cell layer is returned. - When
maxZIndex()is called without arguments, it returns the highest Z value in the graph's default layer. When a layer ID is provided (e.g.maxZIndex(layerId)), the highest Z value in the given layer is returned. - When
minZIndex()is called without arguments, it returns the lowest Z value in the graph's default layer. When a layer ID is provided (e.g.minZIndex(layerId)), the lowest Z value in the given layer is returned.
Additionally, to allow you to listen for layer changes, the Graph now emits new layer events, which allow you to listen for layer changes. These events are propagated model events from each dia.CellLayer and the whole layerCollection.
'layer:add'is triggered when a new layer is added to the graph.'layer:change'is triggered when a layer attribute is changed.'layer:default'is triggered when the layer is designated as a default layer of the graph.'layer:remove'is triggered when a layer is removed from the graph.'layers:sort'is triggered when the order of cell layers withinlayerCollectionchanges.
Also, when a cell is moved to another layer, the Graph triggers the new 'move' event.
dia.GraphLayerCollection:
We exposed a class (inheriting from mvc.Collection) representing a collection of all dia.GraphLayer defined on a Graph.
- You can get an instance of this collection using the
layerCollectionGraph property.
dia.GraphLayer:
We added a new class (inheriting from mvc.Model) to manage a collection of cells ordered by z-index. The inner collection is sorted by z-index automatically.
dia.CellCollection:
We exposed a class (inheriting from mvc.Collection) representing the sorted collection of all dia.Cells in a particular dia.GraphLayer.
- You can get an instance of this collection using the
cellCollectionproperty of a layer.
dia.Cell:
We added a new API method to dia.Cell to support layers functionality:
- The
layer()method allows you to get or set the layer a particular cell belongs to.cell.layer()returns the explicit cell layer ID ornull.cell.layer(layerId)moves the cell to the specified layer.cell.layer(null)moves the cell to the Graph's default layer.
We also changed the behavior of two Cell functions to work with layers:
dia.Paper - rework autoFreeze option
For this release, we completely reworked the autoFreeze option of asynchronous Papers.
If this option is enabled, the paper automatically enters the idle state when there are no cell view updates to process, which reduces CPU usage:
- It stops the
asyncrendering loop when it is not needed. - It enables garbage collection to run sooner, improving resource efficiency.
If the paper is unfrozen, then it may be either in the rendering state or the idle state:
- In the rendering state, the paper checks visibility of each cell view with the
cellVisibility()callback. - When there are no scheduled updates and visibility has been checked for all cell views, the paper enters the idle state (announced by triggering the
'render:idle'event), and performs no further cell view visibility checks. - The paper automatically exits the idle state when there is a new cell view to update.
- You can check the current idle status with
paper.isIdle(). - If you need the paper to re-check cell view visibility while it is in the idle state (e.g. to take scrolling or zooming into account), you must tell it to do so with
paper.wakeUp().
If the paper is in the frozen state, it performs no cell view update/visibility checks.
Here is a state diagram illustrating the new behavior:
The original autoFreeze behavior is still available in legacy mode:
Legacy mode differences:
Legacy mode (see above) is deprecated and will be removed in JointJS v5.
In legacy mode, there is no unfrozen idle state - the paper enters the frozen state when there are no scheduled updates (i.e. the autoFreeze option overrides the frozen option):
- In the unfrozen state, the paper checks visibility of each view with the
viewport()callback. - When there are no scheduled updates and visibility has been checked for all views, the paper enters the frozen state (announced by triggering the
'render:idle'event), and performs no further view visibility checks. - The paper automatically exits the frozen state when there is a new view to update.
- You can check the current frozen status with
paper.isFrozen(). - If you need the paper to re-check view visibility while it is in the frozen state (e.g. to take scrolling or zooming into account), you must tell it to do so with
paper.checkViewport()orpaper.unfreeze().
dia.Paper - add measureNode() callback option
We added a new measureNode() callback option to the Paper, which allows you to customize the logic used by all cell views in the paper whenever JointJS needs to measure any DOM element that is part of the shape.
Details...
If measureNode() option is not specified, the previous logic (V(node).getBBox(), i.e. relying on browser measurements) is used by default.
This option is especially useful with text nodes, whose size always needs to be measured by the browser. This requirement may cause issues when the text node is not guaranteed to be present in the DOM at the moment when JointJS needs to find its bounding box.
The following is an example of using custom logic to measure text nodes in a helper <canvas> element while keeping the default logic for everything else:
// Text measurement with offscreen <canvas> element:
const canvas = document.createElement('canvas');
const canvasContext = canvas.getContext('2d');
function measureTextSize(text: string, fontSize: number, fontFamily: string) {
    canvasContext.font = `${fontSize}px ${fontFamily}`;
    const lines = text.split('\n');

    // Text width = width of the widest line
    const maxWidth = Math.max(...lines.map((line) => {
        return canvasContext.measureText(line).width;
    }));

    // Text height = line height of all lines
    // - multiplier of `1.2` is commonly applied to lines for spacing
    const lineHeight = fontSize * 1.2;
    const textHeight = lines.length * lineHeight;

    return {
        width: maxWidth,
        height: textHeight
    };
}

const paper = new dia.Paper({
    // ...
    measureNode: (node) => {
        if (node.nodeName === 'text') {
            const fontSize = parseFloat(node.getAttribute('font-size')) || 12;
            const fontFamily = node.getAttribute('font-family') || 'Arial';
            const textContent = node.textContent;
            const textSize = measureTextSize(textContent, fontSize, fontFamily);

            const { width, height } = textSize
            const bbox = new g.Rect(0, -height / 2, width, height);
            const textAnchor = node.getAttribute('text-anchor') || 'start';
            if (textAnchor === 'middle') {
                bbox.x = -bbox.width / 2;
            } else if (textAnchor === 'end') {
                bbox.x = -bbox.width;
            }
            return bbox;

        } else {
            // Use default logic for other types of nodes
            return V(node).getBBox();
        }
    }
});
You can try this option to see whether your diagram relies on browser measurement:
const paper = new dia.Paper({
    // ...
    measureNode: () => throw new Error('A DOM measurement was requested!')
});
dia.Paper - add findClosestMagnetToPoint() method
We added a new findClosestMagnetToPoint() method which lets you find the nearest magnet to a given point - i.e. the nearest SVG node that can accept a link connection (e.g. a shape subelement with magnet: true).
It performs a search and returns either:
- an object of the form
{ view, magnet }, whereviewis the owningdia.CellViewinstance andmagnetis the matching SVG element itself, - or
nullif no magnet lies within the search radius.
const point = paper.clientToLocalPoint(evt.clientX, evt.clientY);
const closest = paper.findClosestMagnetToPoint(point, { radius: 50 });
if (closest) {
    // do something with the `closest.view` and `closest.magnet`
}
dia.Paper - add viewManagement option for advanced view lifecycle management
We added a new viewManagement option to Paper for advanced control of CellView lifecycle.
It enables lazy initialization of cell views. It means that a cell view is only created and attached to the DOM when the cellVisibility() callback returns true for the cell (see below).
Previously, all cell views were created at initialization time and kept in memory regardless of whether they were visible or not.
You can fine-tune view management using the following settings:
disposeHidden- Enabling this option tells the paper to completely remove hidden cell views from memory so that they can be garbage collected.initializeUnmounted- Enabling this option tells the Paper to put newly created cells views directly into the unmounted queue. This gives you fine-grained control over which nodes are scheduled for rendering and when (e.g. withpaper.prioritizeCellViewMount()).
const paper = new dia.Paper({
    // ...
    viewManagement: {
        initializeUnmounted: true,
        disposeHidden: true
    }
});
Using viewManagement disables legacy mode (see above):
- The
viewport()callback option is ignored in favor of thecellVisibility()callback option.
Legacy mode is deprecated and will be removed in JointJS v5.
dia.Paper - add cellVisibility() callback option
The new cellVisibility() callback option on Paper determines whether cells should be visible in the paper.
- If the function returns
true, the cell's view is rendered by the paper and attached to the DOM. - If it returns
false, the cell's view is detached/removed from the DOM.
This callback option allows you to specify logic to filter what is inside the paper's model vs. what is rendered in the paper.
For example, you can collapse branches to hide their contents (or similarly, embedded cells in a container), or organize cells into layers and hide an entire layer at once. This makes it easier to manage complex diagrams while keeping all the underlying data in the model.
PaperScroller offers automatic view management functionality based on the user's current viewport out-of-the box with the new virtualRendering option (see above).
Except in legacy mode (see above), the cellVisibility() option replaces the viewport() callback.
cellVisibility() evaluates visibility at the model level (before views are created), while viewport() evaluates it at the view level (after a view is initialized, but before it is rendered).
This switch provides two main advantages:
- Greater efficiency - views no longer need to be initialized only to be immediately hidden.
- More precise scope -
viewport()runs for all views participating in the paper's render loop (e.g. Halo, Selection, Highlighters), requiring manual filtering. In most cases, you only want to check visibility for cell views, whichcellVisibility()handles directly.
Legacy mode differences:
Legacy mode (see above) is deprecated and will be removed in JointJS v5.
The cellVisibility() callback option is ignored in favor of the viewport() callback option.
The viewport() callback runs for all views within the paper, including views other than cell views.
dia.Paper - add disposeHiddenCellViews() method
The new disposeHiddenCellViews() method completely removes all cell views currently hidden by the cellVisibility() callback, rather than just detaching them from the DOM.
This releases their resources. Fully removing views is more efficient than detaching, but disposed views must be re-initialized and re-rendered when they become visible again.
This method does not work in legacy mode (see above). Legacy mode is deprecated and will be removed in JointJS v5.
dia.Paper - add prioritizeCellViewMount() and prioritizeCellViewUnmount() methods
Paper's cell visibility checks are performed in the order views request updates (either when added to the graph or when their model attributes change). In large diagrams, processing all cells can take time, which may negatively affect perceived performance as users navigate.
This release adds paper.prioritizeCellViewMount() and paper.prioritizeCellViewUnmount() to move specific views to the front of the visibility check queue.
Most often, the showing of visible cell views is more important than the hiding of invisible cell views. If you know which cells should currently be visible (for example, because you have just added some to the user's viewport) - you can tell JointJS to process those elements first, which provides an additional performance improvement on top of the viewManagement option (see above).
PaperScroller offers automatic view management functionality based on the user's current viewport out-of-the box with the new virtualRendering option (see above).
dia.Paper - add updateCellVisibility() and updateCellsVisibility() methods
Two new methods simplify the API for cell visibility toggling:
paper.updateCellVisibility()- synchronously update the visibility of a single cell.paper.updateCellsVisibility()- synchronously update the visibility of all cells.
In synchronous mode:
It is up to you use these methods in order to toggle the visibility of cells.
In async mode:
Toggling visibility of cells is done automatically by checking the Paper cellVisibility() callback option periodically. (Note that when the autoFreeze option is enabled, one has to call paper.wakeUp() to re-run the visibility checks.)
In some situations, it still makes sense to use paper.updateCellsVisibility() in async mode to synchronously show/hide cells - for example, before exporting the diagram as an image. If you need to temporarily show different content than the one according to the Paper's cellVisibility() callback option, you can specify a different cellVisibility() callback as an option of the paper.updateCellsVisibility() call.
These methods replace paper.checkViewport() and paper.dumpViews(), which are now deprecated.
// paper.checkViewport();
paper.updateCellsVisibility();

// paper.dumpViews();
paper.updateCellsVisibility({ cellVisibility: () => true });
dia.Paper - add isCellVisible() method
The new paper.isCellVisible() method tells you whether a specific cell is currently visible (i.e. mounted in the paper). See above for an introduction to cell visibility.
dia.Paper - fix to only trigger 'render:idle' event after all updates are completed
The 'render:idle' Paper event is now triggered only when there are no scheduled updates remaining and all views have been checked for visibility.
Details...
Previously, this event could be fired even if the viewport() callback still had additional view updates scheduled (and since the paper had already stopped the rendering loop, those scheduled updates were not processed until the next time the rendering loop was restarted).
dia.Paper - fix generic view detachment when viewport() callback returns false
We now properly remove generic views in case the viewport() Paper callback returns false, as expected.
Details...
Previously, an unhandled exception was thrown when the viewport() callback of Paper returned false for a generic mvc.View object (because of missing view.onDetach() method).
dia.Paper - fix to trigger 'render:*' events when paper model is reset with no cells
We now trigger 'render:done' and 'render:idle' Paper events when graph.resetCells() with no cells is called on Paper's model.
This does not apply to legacy mode (see above). Legacy mode is deprecated and will be removed in JointJS v5.
Details...
Previously, the 'render:*' Paper events were not triggered when graph.resetCells([]) was called, since the triggering logic did not see any added elements. The fact that elements might still have been removed by the reset action was overlooked.
dia.Paper - fix rendering of first batch of updates in async mode to be asynchronous
In Paper async mode, the first batch of updates is now always run asynchronously, as expected.
Details...
Previously, when the paper was initialized with a populated graph, rendering of the first batch was synchronous, and asynchronous rendering was only employed for subsequent batches. This behavior was unexpected and contradicted the documentation.
LinkView
dia.LinkView - allow link-to-link snap
This release enhances link snapping functionality. When the snapLinks paper option is active, dragging a link end can now snap not only to elements and ports, but also to any point along another link's path.
Try the interactive demo below. Drag the arrowhead of the right link toward the left link to see it snap to the link path from a distance.
dia.LinkView - fix to prevent link snap to a magnet when only the host cell is close enough
We fixed a bug where a link could snap to a magnet (e.g. an element port) that was not within its allowed snapLinks radius (in the case that the magnet's host element was within the snapLinks radius).
| Before fix | After fix |
|---|---|
 |  |
dia.LinkView - fix missing arrowheads in WKWebView
We resolved an issue experienced by JointJS apps built on Tauri where link arrowheads were not visible in the diagram's LinkViews.
Details...
One of the strengths of Tauri is that it uses the system's native webview to save on application size. On macOS, the native webview is WKWebView, which uses WebKit under the hood.
The issue is that there is an outstanding bug in WebKit where any change in SVG markers after the first render is not reflected in the DOM. This causes arrowheads to be missing from LinkViews in JointJS diagrams.
We have a workaround for the issue which we apply based on browser detection. Previously, we were checking for Safari and iOS browsers, but this was not generic enough to cover WKWebView (even though WKWebView also uses WebKit under the hood). Therefore, for this release, we updated our browser detection.
CellView
dia.CellView - make getNodeBBox() method work for nodes outside the render tree
The elementView.getNodeBBox() and linkView.getNodeBBox() methods allow you to get the bounding box of a specified node (element/subelement/port) in the paper's coordinate system.
Previously, this method would fail if the cell view was outside the render tree. We updated the underlying algorithm (see below) so that this restriction no longer applies.
dia.CellView - optimize measurements of nodes referenced by ref attribute
To improve performance, we now use cached bounding rect dimensions when measuring nodes referenced by the ref attribute.
Graph
dia.Graph - add syncCells() method
We've added a new convenient syncCells() method for efficiently updating the graph with new data. The method automatically ensures that:
- New cells are added.
- Modified cells are updated.
- Missing cells are removed (only if
{ remove: true }is specified).
You can either provide the JSON directly, or generate it from another source of truth and apply to the graph model:
const updatedJSON = await fetch('/diagram/1');
// Sync the current graph with the updated JSON
graph.syncCells(updatedJSON.cells, { remove: true });
The syncCell() method provides a simple way to change the type of an element:
graph.resetCells([{
    id: 'my-element-id',
    type: 'standard.Rectangle'
}]);
// ...
const [rectangle] = graph.getElements();
const circle = new shapes.standard.Circle({ id: rectangle.id });
graph.syncCells([circle]);
The syncCell() method provides a simple way to change the type of a link based on existing source and target:
graph.resetCells([{
    // ... add `source` and `target` elements
}, {
    id: 'my-link-id',
    type: 'standard.Link',
    source: { id: 'source-id' },
    target: { id: 'target-id' }
}]);
// ...
graph.syncCells([{
    id: 'my-link-id',
    type: 'standard.DoubleLink',
    target: { id: 'new-target-id' }
}]);
dia.Graph - add removeCell() method
We added a new removeCell() method to Graph, which unifies the removal logic of embedded children and connected links.
Details...
Previously, the Cell was responsible for removing embedded children, while the Graph removed connected links. The updated implementation moves all cleanup logic into graph.removeCell(). All existing cell.remove() invocations within the Graph codebase have been replaced accordingly.
Element
dia.Element - add filter option to fitToChildren() and fitParent() methods
The new filter option for element.fitToChildren() and element.fitParent() methods lets you provide a callback that returns true when an element-type child should be included in the fitting.
This option is useful, for example, when some children become hidden (but remain in the graph model) and you want the parent to fit only around the visible elements.
element.fitToChildren({
    filter: (el) => (!el.get('hidden'))
});
dia.Element - add minRect option to fitToChildren() and fitParent() methods
The new minRect option for element.fitToChildren() and element.fitParent() lets you define the minimum area a shape must occupy, regardless of its children.
This ensures a container maintains a baseline size—for example, when child elements are too small or absent.
element.fitToChildren({
    minRect: { x: 20, y: 20, width: 100, height: 20 }
});
dia.Element - support port position args inside position property
Previously, port position arguments were read from the top-level args property, unlike port groups and port labels, which used position.args.
For clarity and consistency, this release aligns all three: a port's position.args is now the source of truth for its position. For example:
// Before:
element1.addPort({
    group: 'left',
    args: {
        dx: 20
    }
});

// After:
element1.addPort({
    group: 'left',
    position: {
        args: {
            dx: 20
        }
    }
});
To keep backwards compatibility, if there are no position.args, args are checked as a fallback.
dia.Element - add getPortBBox() and getPortCenter() methods
We introduced new element.getPortBBox() and element.getPortCenter() methods to retrieve the bounding box and center of a specific port. The methods include caching to avoid redundant port layout calculations on repeated calls.
Since getting a bounding box and getting a center of an item are ones of the most common operations in JointJS, any related optimizations (in this case, for ports) can have large cumulative benefits on the performance of JointJS as a whole.
Details...
Previously, getting the port bounding box and port center required recalculating all port positions and then manually adjusting for the port's offset and rotation - all without caching.
Here is an example of code we were able to replace in our codebase thanks to element.getPortCenter():
// BEFORE:
const bbox = element.getBBox();
const port = element.getPort(portId);
const portsPositions = element.getPortsPositions(port.group);
const portCenter = new g.Point(portsPositions[portId]).offset(bbox.topLeft());
const angle = element.angle();
if (angle) portCenter.rotate(center, -angle);

// AFTER:
const portCenter = element.getPortCenter(portId);
dia.Element - support custom portLayoutNamespace and portLabelLayoutNamespace
In this release, we made it possible to provide portLayoutNamespace and portLabelLayoutNamespace options when creating an element, which allows you to specify custom port layout functions and custom port label layout functions which are persisted across serialization/deserialization:
Code example...
You can define custom port layout and port label layout functions inside namespaces:
const portLayoutNamespace = {
    ...layout.Port,
    myPortLayout: (portsArgs, elBBox, opt) => {
        // Runs for each port group
        // Returns an array of port positions
    }
};

const portLabelLayoutNamespace = {
    ...layout.PortLabel,
    myPortLabelLayout: (portPosition, elBBox, opt) => {
        // Returns port label position
    }
};
These layout functions can then be referenced in an element's ports property:
{
    id: 'my-element',
    type: 'standard.Rectangle',
    position: { x: 200, y: 150 },
    size: { width: 100, height: 100 },
    ports: {
        groups: {
            myGroup: {
                position: { name: 'myPortLayout' },
                label: { position: { name: 'myPortLabelLayout' } }
            }
        },
        items: [{ id: 'myPort', group: 'myGroup' }]
    }
}
When loading elements from JSON, pass the namespaces as options to make the custom layout functions available:
graph.fromJSON(json, {
  portLayoutNamespace,
  portLabelLayoutNamespace
});
You can also pass the namespaces when creating a single element:
const rectangle = new shapes.standard.Rectangle({
    position: { x: 200, y: 150 },
    size: { width: 100, height: 100 },
    // ...
}, {
    portLayoutNamespace,
    portLabelLayoutNamespace
});
dia.Element - support passing custom port label layout functions to label.position
In this release, we made it possible to pass a custom port label layout function as label.position (also group.label.position) in the same way that it is currently possible to pass a custom port layout function as group.position.
Code example...
const rectangle = new shapes.standard.Rectangle({
    // ...
    ports: {
        groups: {
            left: {
                position: {
                    name: 'left'
                }
                label: {
                    // `label.position` defined by reference to `PortLabelLayoutNamespace`
                    position: {
                        name: 'left',
                        args: {
                            dx: 10
                        }
                    }
                }
            },
            right: {
                position: {
                    name: 'right'
                }
                label: {
                    // (NEW) `label.position` defined via custom function
                    position: (_portPosition, _elBBox, opt) => {
                        return util.defaultsDeep({}, opt, {
                            x: 15,
                            y: 0,
                            angle: 0,
                            attrs: {
                                labelText: {
                                    y: '.3em',
                                    textAnchor: 'start'
                                }
                            }
                        });
                    }
                }
            },
        },
        items: [{
            id: 'left1',
            group: 'left'
        }, {
            id: 'left2',
            group: 'left'
        }, {
            id: 'right1',
            group: 'right'
        }, {
            id: 'right2',
            group: 'right'
        }]
    }
});
dia.Element - optimize cloning in getPort() method
Previously, when cloning a port via element.getPort(), we would clone all ports and then find the one we wanted. That was inefficient; in the current version, we find the port we want first and only clone that one port.
dia.Element - optimize hasPort() and hasPorts() methods
We improved the performance of element.hasPort() and element.hasPorts() by leveraging internal data structures for constant-time (O(1)) lookups, replacing the previous linear-time (O(n)) approach.
dia.Element - fix to parse numeric strings in port position args
We now convert string-type x and y port position arguments to numbers (e.g. { x: '107', y: '15' } => { x: 107, y: 15 }).
Details...
Previously, calling link.getBBox() could produce incorrect values when port.position arguments were given as numeric strings, because port position calculations operated under the assumption that they were working with numbers.
Cell
dia.Cell - add getCenter() method
We added a new cell.getCenter() method as a lighter counterpart to cell.getBBox() (see element.getBBox(), link.getBBox()).
Details...
Previously, getting the center of an element required computing the full bounding box and then extracting the center, i.e. creating a temporary g.Rect object which was immediately marked for garbage collection. The center of a cell is frequently needed in calculations, so this method provides a slight reduction in memory usage.
dia.Cell - add cell attributes merge strategy
We added two new configuration options to the config namespace:
cellDefaultsMergeStrategyallows you to customize how cell attributes are merged during initialization. By default, the constructor array-type attribute value replaces the default array-type attribute value.cellMergeStrategyallows you to customize how cell attributes are merged during property updates. By default, the new array-type attribute value is merged into the old array-type attribute value.
You may provide your own merge callback functions to modify the default behavior.
Here is how you can restore the merging
cell defaults merge strategy from JointJS+ v3.7 (which was changed in a breaking change in JointJS+ v4.0), without having to use the mergeArrays Cell option everywhere:
config.cellDefaultsMergeStrategy = () => {};
Additionally, here is how you can apply the replacing
merge strategy to all property updates, without having to use the rewrite option everywhere:
config.cellMergeStrategy = (a, b) => {
    if (Array.isArray(a)) {
        return b;
    }
};
dia.Cell - support array paths in transition() and stopTransition() methods
We are adding support for array paths to the transition() and stopTransitions() Cell methods. You can see examples of string paths and array paths in the cell.attr() documentation.
This change aligns the cell transition API with other Cell methods (like prop(), attr(), removeProp(), removeAttr()), all of which already support both string and array paths.
// array path
element.transition(['position', 'x'], 250, { /* options */ });

// string path
element.transition('position/x', 250, { /* options */ });
dia.Cell - expose getAttributeDefinition() method
We are exposing the static Cell.getAttributeDefinition() method, which allows you to find out, at run time, how JointJS will process a special presentation attribute with a given name within subelements of a given Cell.
Keep in mind that since we are in the attributes context, all attributes have to be addressed with kebab-case naming (e.g. 'text-wrap' instead of textWrap), because this is a lower-level API of JointJS and the kebab-case to camelCase translation functionality is not available.
-
If an attribute definition is found, the method returns a definition object which consists of optional
set,unset,positionandoffsetproperties. See the Custom special presentation attributes documentation for more information. -
If an attribute definition is not found, the function returns
null. Note that this happens for all attributes for which JointJS does not implement special logic, including native attributes (like'font-size').
dia.Cell - fix to always create deep copy of arrays in constructor
We fixed array handling in the Cell constructor by always creating a deep copy of arrays rather than reusing the original instances.
Details...
Specifically, the problem occurred when the default values of the model attributes contained an array value:
const MyElement = dia.Element.define('MyElement', { attribute: [] });
const array = [1, 2];
const myElement = new MyElement({ attribute: array });
// now: `myElement.get('attribute') !== array`

const myElement2 = myElement.clone();
// now: `myElement2.get('attribute') !== myElement.get('attribute')`
attributes
dia.attributes - add useNoBreakSpace which reinstates V.sanitizeText() functionality
Previously, the text set via the text attribute was passed through the V.sanitizeText() method first. This step is no longer necessary and was removed alongside the deprecation of V.sanitizeText() itself (see below).
If you relied on the conversion of U+0020 to U+00A0 in your code, you can re-enable it by setting the useNoBreakSpace attribute with a value of true on the same subelement. For example:
element.attr('label', {
    text: '  Text',
    useNoBreakSpace: true
});
dia.attributes - fix textWrap attribute when Paper is not in render tree
Previously, the textWrap attribute required the Paper's <SVGSVGElement> to be in the render tree.
For this version, we are adding a fix so that a temporary SVG element is used to perform textWrap calculations in the case that the Paper is not in the DOM.
HighlighterView
dia.HighlighterView - z option now supports highlighter positioning within SVG
We've extended the z option to let you control where a highlighter is inserted within a cell view's SVG structure.
When no layer is specified, the highlighter is placed inside the cell view's root SVG element. The z option now lets you define its index among the SVG's children.
This lets you position the highlighter beneath the shape while keeping it part of the shape, so that:
- The hit area is extended.
- Hover effects continue to work.
Great for Stencil shapes - a cross-browser way to extend the hit area of irregular shapes!
The pointer-events: bounding-box is not supported in Firefox.
dia.HighlighterView - add static has() method to check if CellView has a highlighter attached
We added a new static HighlighterView.has() method, which allows you to check whether an instance of a HighlighterView is applied to the given cellView:
// Does `cellView` have an instance of `highlighters.addClass` with `id: 'H1'` added?
highlighters.addClass.has(cellView, 'H1');

// Does `cellView` have any instance of `highlighters.addClass` added?
highlighters.addClass.has(cellView);
dia.HighlighterView - fix to prevent highlighting nodes outside of cell view
We are adding an additional check to the static HighlighterView.add() method to prevent potential issues with SVGElement-type selector arguments.
Starting with this release, the provided SVGElement has to be part of highlighter's related cellView. Otherwise, the SVGElement does not get highlighted and a cell:highlighter:invalid event is triggered instead (similar to what happens when a non-existent selector is provided).
What is the issue?
It makes perfect sense to want to apply a highlighter to an element port node rather than an element's subelement node. However, there is an important difference between the two: port nodes are re-rendered on each ports update (unlike subelement nodes).
This means that an SVGElement instance provided when applying the highlighter may be unexpectedly removed from the DOM, causing the highlighter to throw an unhandled error.
This is not a problem with JSON-based selectors because they always allow the highlighter to look up the port node based on the port ID (which is consistent across re-renders of the port).
If you need to apply a highlighter to an element port, use a JSON-based selector argument. For example:
highlighters.addClass.add(
    elementView, // cellView
    { port: 'port1', selector: 'portBody' }, // selector
    'my-highlighter-id', // id
    { className: 'my-custom-class' } // options
);
dia.HighlighterView - fix to prevent removing not-yet-mounted HighlighterViews on unmount
Previously, adding a highlighter on a hidden subelement of an element (e.g. a hidden port) would permanently remove the highlighter from the document, so that it would not be shown again. Now, the highlighter is kept, so that it can be shown again when the hidden subelement is shown again.
elementTools
elementTools - fix tools position when attached directly to ElementView
In this release, we fixed the positioning of elementTools when attached directly to an element view:
const toolsView = new dia.ToolsView({
    layer: null, // attach directly to ElementView
    tools: [/* ... your tools here ... */]
});
elementView.addTools(toolsView);
Attaching tools directly to an ElementView is useful when you want them to be part of the element's SVG. For example, if one element partially overlaps another, a tool attached to the lower element will remain visually beneath the overlapping element, rather than appearing through
it.
Details...
There are two types of tools:
- Relative tools - follow the element's coordinate system, geometry, and rotation (
layer: null). - Overlay tools - follow graph coordinates, independent of the element's geometry or rotation (
layer: 'tools').
Previously, relative tools attached directly to an element view were transformed twice:
- Once by the element's own SVG transform (position, rotation, etc.)
- Once by the explicit transform that we normally add for overlay tools to align them with the element
This double transformation caused tools to be positioned incorrectly. This issue is now fixed, so relative tools attached directly to an element view will correctly follow the element's geometry without the extra transform.
The problem never affected link tools because link views have no transform of their own.
linkTools
linkTools.Vertices - fix to call blur when redundancyRemoval: false
We fixed the blur logic of the Vertices link tool when redundancyRemoval: false, so that its behavior is in line with other link tools.
anchors
anchors - add useModelGeometry option to all anchors
We added the useModelGeometry option to all anchors. When set to true, the anchor algorithm uses geometry model attributes (position and size) of the connected magnet (element or port) to calculate the anchor point, instead of relying on browser's DOM measurements (which are much slower).
This is ideal for scenarios that require DOM-independent rendering, or for performance-sensitive environments (e.g. diagrams with thousands of cells).
Full list of changes...
- Add
useModelGeometrytobottomanchor function. - Add
useModelGeometrytobottomLeftanchor function. - Add
useModelGeometrytobottomRightanchor function. - Add
useModelGeometrytocenteranchor function. - Add
useModelGeometrytoleftanchor function. - Add
useModelGeometrytomidSideanchor function. - Add
useModelGeometrytoperpendicularanchor function. - Add
useModelGeometrytorightanchor function. - Add
useModelGeometrytotopanchor function. - Add
useModelGeometrytotopLeftanchor function. - Add
useModelGeometrytotopRightanchor function.
anchors - add support for calc() expressions in dx, dy options
We added support for calc() expressions when offsetting anchors (i.e. dx and dy args).
link.prop('source/anchor', {
    name: 'topLeft',
    args: {
        dx: 'calc(w - 20)', // previously only a number or percentage
        dy: 'calc(h - 20)'
    }
});
Full list of changes...
- Add support for
calc()expressions inbottomanchor function. - Add support for
calc()expressions inbottomLeftanchor function. - Add support for
calc()expressions inbottomRightanchor function. - Add support for
calc()expressions incenteranchor function. - Add support for
calc()expressions inleftanchor function. - Add support for
calc()expressions inrightanchor function. - Add support for
calc()expressions intopanchor function. - Add support for
calc()expressions intopLeftanchor function. - Add support for
calc()expressions intopRightanchor function.
anchors.midSide - add mode and preferenceThreshold options
We added two new options to the midSide anchor function:
- mode - Defines the strategy for choosing the anchor side relative to the reference point (
'prefer-horizontal','prefer-vertical','horizontal','vertical','auto'). - preferenceThreshold - Used with
'prefer-*'modes. Specifies how close the reference point must be to a non-preferred side to override the preference. Can be a number or an object with side-specific values.
Try the interactive demo below:
- Use the Anchor Mode dropdown to switch between different modes.
- Use the Preference Threshold slider to adjust the threshold for the
'prefer-*'modes. - Move the rectangles to see the anchor side update in real time.
This anchor is ideal for layouts that flow left-to-right or top-to-bottom, ensuring links connect to opposing element sides rather than simply the nearest ones.
connectionPoints
connectionPoints - add useModelGeometry option to bbox and rectangle
We added the useModelGeometry option to bbox and rectangle connectionPoints. When set to true, the connection point algorithm uses geometry model attributes (position and size) of the connected magnet (element or port) to calculate the connection point, instead of relying on browser's DOM measurements (which are much slower).
This is ideal for scenarios that require DOM-independent rendering, or for performance-sensitive environments (e.g. diagrams with thousands of cells).
mvc
mvc.View - allow providing custom cid in constructor
Custom cid may now be provided via mvc.View constructor. This is occasionally useful when the cid is required to stay consistent (e.g. when re-creating a view for a model).
const myView = new mvc.View({ cid: 'custom-cid-123' });
mvc.Collection - use a Map to store references
In this release, we changed the implementation of the internal _byId map of mvc.Collection from a plain JavaScript object to a native Map object.
This change improves performance of add/remove operations within a collection, which had a noticeable effect on the speed of Graph resetCells() operation with a large amount of cells.
V
Vectorizer - add safe option to getTransformToElement() method
The vel.getTransformToElement() method returns an SVGMatrix that specifies the transformation necessary to convert vel coordinate system into the coordinate system of a specified target node. It is used internally by cellView.getNodeBBox() (see above).
Previously, the method relied exclusively on browser calculations (via SVGGraphicsElement.getScreenCTM()) which required both vel and the target node to be visible (in the render tree).
The new safe option (e.g. vel.getTransformToElement(target, { safe: true })) switches the method to an alternative calculation which does not require either node to be visible (in the render tree), as long as the two have a common ancestor.
Vectorizer - add static getCommonAncestor() method
The new V.getCommonAncestor() static method returns the SVGElement which is the common ancestor of two provided SVGElements. If there is no common ancestor, it returns null. It is used internally by the safe
mode of vel.getTransformToElement().
Vectorizer - add useNoBreakSpace option to text() method
Previously, the text set via the vel.text() method was passed through the V.sanitizeText() method first. This step is no longer necessary and was removed alongside the deprecation of V.sanitizeText() itself (see below).
If you relied on the conversion of U+0020 to U+00A0 in your code, you can re-enable it by passing the useNoBreakSpace option to vel.text() (e.g. vel.text(content, { useNoBreakSpace: true })).
Vectorizer - deprecate static sanitizeText() method
We are deprecating the V.sanitizeText() static method since its functionality (the conversion of U+0020 to U+00A0) is no longer necessary and can be safely removed from the codebase.
Vectorizer - fix to preserve camelCase in attributeName, repeatCount attribute names
We now keep the valid <animate> element attribute names attributeName and repeatCount as camelCase instead of converting them to kebab-case.
Vectorizer - fix to handle implicit line coordinates in convertToPathData() method
We fixed an issue with the V.convertToPathData() method when a <line> element was provided which was missing start and/or end coordinate attributes. Previously, the missing values were added to the returned string as empty strings (''), which produced corrupt path data (e.g. 'M L').
In the new version, missing <line> coordinate attributes are added to the returned string as '0', producing path data that is correct according to the SVG specification (e.g. 'M 0 0 L 0 0').
g
Geometry - add moveAroundPoint() method to Rect
The new rect.moveAroundPoint() method moves the rectangle around the given point by the given angle.
The method does not rotate the rectangle, it just moves its center by the given angle around the given point.
Other changes
Fix to keep 'use strict' for minified files
Minified JointJS and JointJS+ files (e.g. JointJS dist/joint.min.js or JointJS+ (non-enterprise) build/package/joint-plus.tgz) were previously distributed with all 'use strict' statements removed.
This could lead to errors in contexts where strict mode is not implied (e.g. when using the files directly without an ES6 import statement, like what we recommend for using JointJS without a build process).
We fixed all distributed minified files for this release.
Fix exported namespaces and filenames of individual JointJS+ plugin build files
Enterprise customers of JointJS+ receive an IIFE version of individual plugins' source code (in the build folder of their JointJS+ package). We took a closer look at these files and discovered several deviations from the standard installable package (build/package/joint-plus.tgz), which we are resolving in this release:
- We fixed the namespaces under which the contents of these files are exported so that the IIFEs are in line with the standard installable package.
- We adjusted the filenames of these files to match the exported namespace and to match the capitalization of the exported content according to the documentation.
- We adjusted the filenames of individual plugins' exported CSS files (
.cssand.min.css) to match the new filenames.
Full list of changes...
Changed exported namespace (and filename, where applicable):
joint.elementTools.RecordScrollbar.js(wasjoint.shapes.recordScrollbar.js)- exported namespace
joint.elementTools(wasjoint.shapes)
- exported namespace
joint.elementTools.SwimlaneBoundary.js(wasjoint.shapes.bpmn2SwimlaneBoundary.js)- exported namespace
joint.elementTools(wasjoint.shapes)
- exported namespace
joint.elementTools.SwimlaneTransform.js(wasjoint.shapes.bpmn2SwimlaneTransform.js)- exported namespace
joint.elementTools(wasjoint.shapes)
- exported namespace
joint.shapes.bpmn2.js- exported namespace
joint.shapes.bpmn2(wasjoint.shapes)
- exported namespace
joint.shapes.chart.js- exported namespace
joint.shapes.chart(wasjoint.shapes)
- exported namespace
joint.shapes.measurement.js- exported namespace
joint.shapes.measurement(wasjoint.shapes)
- exported namespace
joint.shapes.record.js- exported namespace
joint.shapes.standard(wasjoint.shapes)
- exported namespace
joint.shapes.vsm.js- exported namespace
joint.shapes.vsm(wasjoint.shapes)
- exported namespace
Changed filename (exported namespace not changed):
joint.dia.CommandManager.js(wasjoint.dia.command.js)joint.ui.widgets.js(wasjoint.ui.toolbarWidgets.js)
Changed filename capitalization (exported namespace not changed):
joint.alg.Dijkstra.js(wasjoint.alg.dijkstra.js)joint.alg.PriorityQueue.js(wasjoint.alg.priorityQueue.js)joint.dia.SearchGraph.js(wasjoint.dia.searchGraph.js)joint.dia.Validator.js(wasjoint.dia.validator.js)joint.format.Visio.js(wasjoint.format.visio.js)joint.layout.ForceDirected.js(wasjoint.layout.forceDirected.js)joint.layout.GridLayout.js(wasjoint.layout.gridLayout.js)joint.layout.StackLayout.js(wasjoint.layout.stackLayout.js)joint.layout.TreeLayout.js(wasjoint.layout.treeLayout.js)joint.storage.Local.js(wasjoint.storage.local.js)joint.ui.BPMNFreeTransform.js(wasjoint.ui.bpmnFreeTransform.js)joint.ui.Clipboard.js(wasjoint.ui.clipboard.js)joint.ui.ColorPalette.css(wasjoint.ui.colorPalette.css)joint.ui.ColorPalette.js(wasjoint.ui.colorPalette.js)joint.ui.ColorPalette.min.css(wasjoint.ui.colorPalette.min.css)joint.ui.ContextToolbar.css(wasjoint.ui.contextToolbar.css)joint.ui.ContextToolbar.js(wasjoint.ui.contextToolbar.js)joint.ui.ContextToolbar.min.css(wasjoint.ui.contextToolbar.min.css)joint.ui.Dialog.css(wasjoint.ui.dialog.css)joint.ui.Dialog.js(wasjoint.ui.dialog.js)joint.ui.Dialog.min.css(wasjoint.ui.dialog.min.css)joint.ui.FlashMessage.css(wasjoint.ui.flashMessage.css)joint.ui.FlashMessage.js(wasjoint.ui.flashMessage.js)joint.ui.FlashMessage.min.css(wasjoint.ui.flashMessage.min.css)joint.ui.FreeTransform.css(wasjoint.ui.freeTransform.css)joint.ui.FreeTransform.js(wasjoint.ui.freeTransform.js)joint.ui.FreeTransform.min.css(wasjoint.ui.freeTransform.min.css)joint.ui.Halo.css(wasjoint.ui.halo.css)joint.ui.Halo.js(wasjoint.ui.halo.js)joint.ui.Halo.min.css(wasjoint.ui.halo.min.css)joint.ui.Inspector.css(wasjoint.ui.inspector.css)joint.ui.Inspector.js(wasjoint.ui.inspector.js)joint.ui.Inspector.min.css(wasjoint.ui.inspector.min.css)joint.ui.Keyboard.js(wasjoint.ui.keyboard.js)joint.ui.Lightbox.css(wasjoint.ui.lightbox.css)joint.ui.Lightbox.js(wasjoint.ui.lightbox.js)joint.ui.Lightbox.min.css(wasjoint.ui.lightbox.min.css)joint.ui.Navigator.css(wasjoint.ui.navigator.css)joint.ui.Navigator.js(wasjoint.ui.navigator.js)joint.ui.Navigator.min.css(wasjoint.ui.navigator.min.css)joint.ui.PaperScroller.css(wasjoint.ui.paperScroller.css)joint.ui.PaperScroller.js(wasjoint.ui.paperScroller.js)joint.ui.PaperScroller.min.css(wasjoint.ui.paperScroller.min.css)joint.ui.PathDrawer.css(wasjoint.ui.pathDrawer.css)joint.ui.PathDrawer.js(wasjoint.ui.pathDrawer.js)joint.ui.PathDrawer.min.css(wasjoint.ui.pathDrawer.min.css)joint.ui.PathEditor.css(wasjoint.ui.pathEditor.css)joint.ui.PathEditor.js(wasjoint.ui.pathEditor.js)joint.ui.PathEditor.min.css(wasjoint.ui.pathEditor.min.css)joint.ui.Popup.css(wasjoint.ui.popup.css)joint.ui.Popup.js(wasjoint.ui.popup.js)joint.ui.Popup.min.css(wasjoint.ui.popup.min.css)joint.ui.RadioGroup.css(wasjoint.ui.radioGroup.css)joint.ui.RadioGroup.js(wasjoint.ui.radioGroup.js)joint.ui.RadioGroup.min.css(wasjoint.ui.radioGroup.min.css)joint.ui.SelectBox.css(wasjoint.ui.selectBox.css)joint.ui.SelectBox.js(wasjoint.ui.selectBox.js)joint.ui.SelectBox.min.css(wasjoint.ui.selectBox.min.css)joint.ui.SelectButtonGroup.css(wasjoint.ui.selectButtonGroup.css)joint.ui.SelectButtonGroup.js(wasjoint.ui.selectButtonGroup.js)joint.ui.SelectButtonGroup.min.css(wasjoint.ui.selectButtonGroup.min.css)joint.ui.Selection.css(wasjoint.ui.selection.css)joint.ui.Selection.js(wasjoint.ui.selection.js)joint.ui.Selection.min.css(wasjoint.ui.selection.min.css)joint.ui.SelectionRegion.js(wasjoint.ui.selectionRegion.js)joint.ui.Snaplines.css(wasjoint.ui.snaplines.css)joint.ui.Snaplines.js(wasjoint.ui.snaplines.js)joint.ui.Snaplines.min.css(wasjoint.ui.snaplines.min.css)joint.ui.StackLayoutView.js(wasjoint.ui.stackLayoutView.js)joint.ui.Stencil.css(wasjoint.ui.stencil.css)joint.ui.Stencil.js(wasjoint.ui.stencil.js)joint.ui.Stencil.min.css(wasjoint.ui.stencil.min.css)joint.ui.TextEditor.css(wasjoint.ui.textEditor.css)joint.ui.TextEditor.js(wasjoint.ui.textEditor.js)joint.ui.TextEditor.min.css(wasjoint.ui.textEditor.min.css)joint.ui.Toolbar.css(wasjoint.ui.toolbar.css)joint.ui.Toolbar.js(wasjoint.ui.toolbar.js)joint.ui.Toolbar.min.css(wasjoint.ui.toolbar.min.css)joint.ui.Tooltip.css(wasjoint.ui.tooltip.css)joint.ui.Tooltip.js(wasjoint.ui.tooltip.js)joint.ui.Tooltip.min.css(wasjoint.ui.tooltip.min.css)joint.ui.TreeLayoutView.css(wasjoint.ui.treeLayoutView.css)joint.ui.TreeLayoutView.js(wasjoint.ui.treeLayoutView.js)joint.ui.TreeLayoutView.min.css(wasjoint.ui.treeLayoutView.min.css)joint.ui.Widget.js(wasjoint.ui.widget.js)
No changes:
joint.format.bpmnExport.jsjoint.format.bpmnImport.jsjoint.format.gexf.jsjoint.format.print.cssjoint.format.print.jsjoint.format.print.min.cssjoint.format.raster.jsjoint.format.svg.jsjoint.graphUtils.js